

Answered step by step
Verified Expert Solution
Question
1 Approved Answer
forecast short-term growth rate and long-term growth rate based on the following information. 2018 2016 2017 $ 250,000 125,000 125,000 $ 200,000 110,000 90,000 $
forecast short-term growth rate and long-term growth rate based on the following information.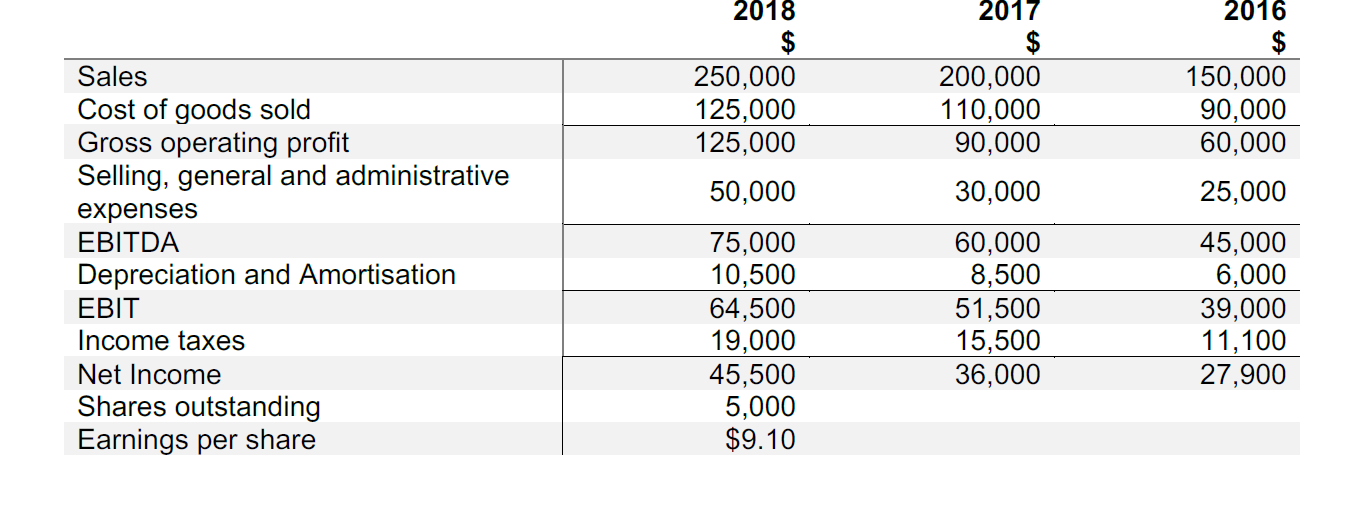
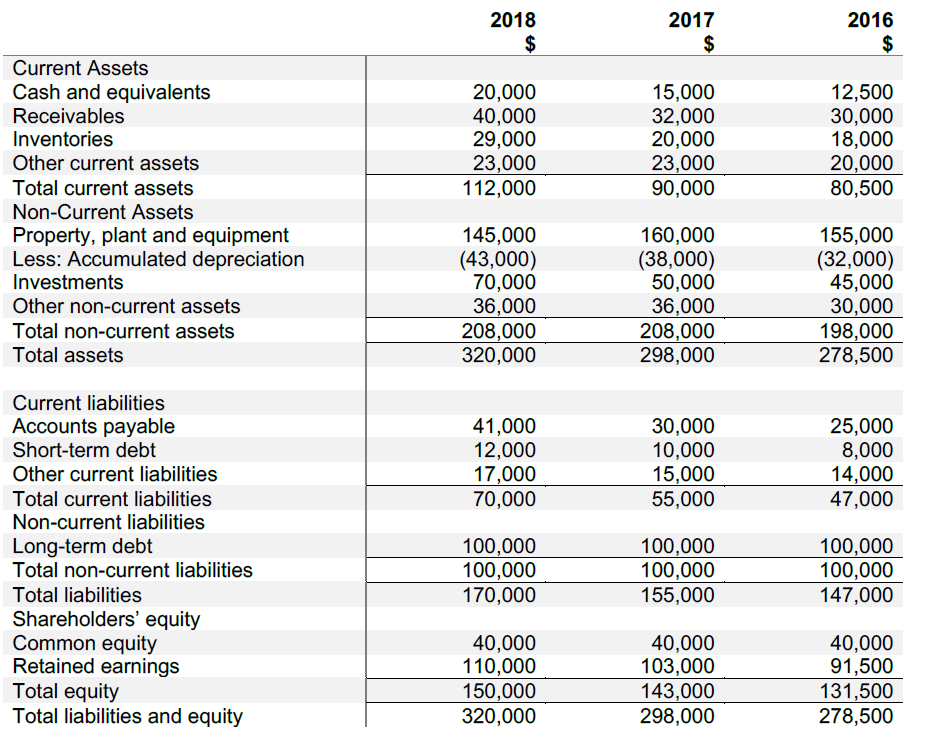
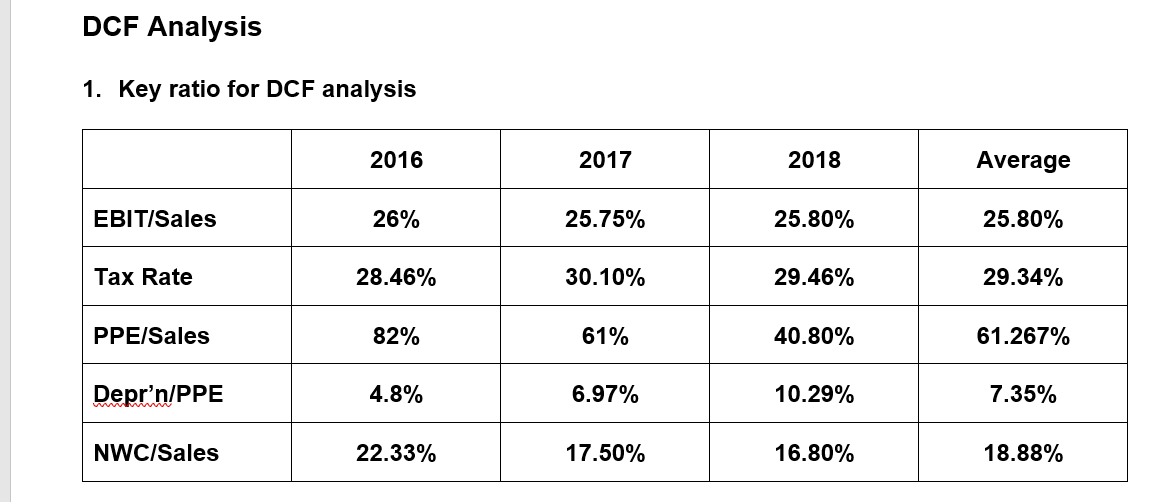
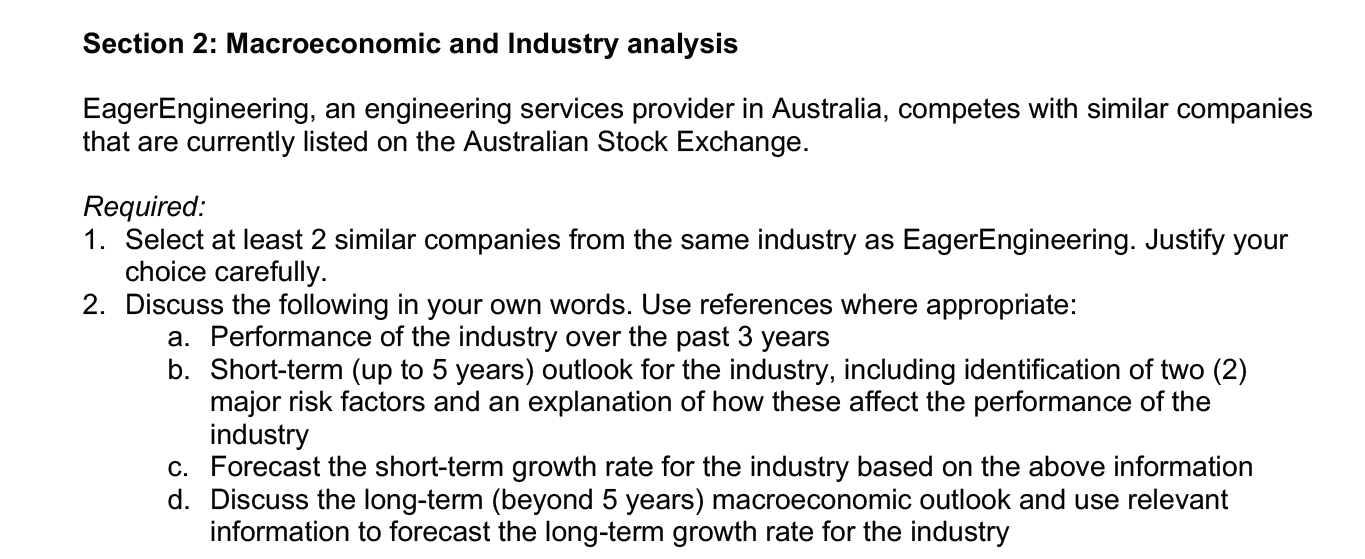
2018 2016 2017 $ 250,000 125,000 125,000 $ 200,000 110,000 90,000 $ 150,000 90,000 60,000 Sales Cost of goods sold Gross operating profit Selling, general and administrative 50,000 30,000 25,000 expenses EBITDA 75,000 10,500 64,500 19,000 45,500 5,000 $9.10 45,000 6,000 39,000 60,000 8,500 51,500 15,500 36,000 Depreciation and Amortisation EBIT 11,100 27,900 Income taxes Net Income Shares outstanding Earnings per share 2018 2017 2016 $ $ Current Assets Cash and equivalents Receivables 20,000 40,000 29,000 23,000 112,000 15,000 32,000 20,000 23,000 90,000 12,500 30,000 18,000 20,000 80,500 Inventories Other current assets Total current assets Non-Current Assets 145,000 (43,000) 70,000 36,000 208,000 320,000 160,000 (38,000) 50,000 36,000 208,000 298,000 Property, plant and equipment Less: Accumulated depreciation Investments 155,000 (32,000) 45,000 30,000 198,000 278,500 Other non-current assets Total non-current assets Total assets Current liabilities Accounts payable Short-term debt 41,000 12,000 17,000 70,000 30,000 10,000 15,000 55,000 25,000 8,000 14,000 47,000 Other current liabilities Total current liabilities Non-current liabilities Long-term debt Total non-current liabilities 100,000 100,000 155,000 100,000 100,000 170,000 100,000 100,000 147,000 Total liabilities Shareholders' equity Common equity Retained earnings Total equity Total liabilities and equity 40,000 91,500 131,500 278,500 40,000 110,000 150,000 320,000 40,000 103,000 143,000 298,000 DCF Analysis 1. Key ratio for DCF analysis 2016 2017 2018 Average 26% 25.80% EBIT/Sales 25.75% 25.80% 30.10% 29.46% Tax Rate 28.46% 29.34% 61% PPE/Sales 82% 40.80% 61.267% Depr n/PPE 4.8% 10.29% 7.35% 6.97% 18.88% NWC/Sales 22.33% 17.50% 16.80% Section 2: Macroeconomic and Industry analysis EagerEngineering, an engineering services provider in Australia, competes with similar companies that are currently listed on the Australian Stock Exchange. Required: 1. Select at least 2 similar companies from the same industry as EagerEngineering. Justify your choice carefully 2. Discuss the following in your own words. Use references where appropriate: a. Performance of the industry over the past 3 years b. Short-term (up to 5 years) outlook for the industry, including identification of two (2) major risk factors and an explanation of how these affect the performance of the industry c. Forecast the short-term growth rate for the industry based on the above information d. Discuss the long-term (beyond 5 years) macroeconomic outlook and use relevant information to forecast the long-term growth rate for the industry 2018 2016 2017 $ 250,000 125,000 125,000 $ 200,000 110,000 90,000 $ 150,000 90,000 60,000 Sales Cost of goods sold Gross operating profit Selling, general and administrative 50,000 30,000 25,000 expenses EBITDA 75,000 10,500 64,500 19,000 45,500 5,000 $9.10 45,000 6,000 39,000 60,000 8,500 51,500 15,500 36,000 Depreciation and Amortisation EBIT 11,100 27,900 Income taxes Net Income Shares outstanding Earnings per share 2018 2017 2016 $ $ Current Assets Cash and equivalents Receivables 20,000 40,000 29,000 23,000 112,000 15,000 32,000 20,000 23,000 90,000 12,500 30,000 18,000 20,000 80,500 Inventories Other current assets Total current assets Non-Current Assets 145,000 (43,000) 70,000 36,000 208,000 320,000 160,000 (38,000) 50,000 36,000 208,000 298,000 Property, plant and equipment Less: Accumulated depreciation Investments 155,000 (32,000) 45,000 30,000 198,000 278,500 Other non-current assets Total non-current assets Total assets Current liabilities Accounts payable Short-term debt 41,000 12,000 17,000 70,000 30,000 10,000 15,000 55,000 25,000 8,000 14,000 47,000 Other current liabilities Total current liabilities Non-current liabilities Long-term debt Total non-current liabilities 100,000 100,000 155,000 100,000 100,000 170,000 100,000 100,000 147,000 Total liabilities Shareholders' equity Common equity Retained earnings Total equity Total liabilities and equity 40,000 91,500 131,500 278,500 40,000 110,000 150,000 320,000 40,000 103,000 143,000 298,000 DCF Analysis 1. Key ratio for DCF analysis 2016 2017 2018 Average 26% 25.80% EBIT/Sales 25.75% 25.80% 30.10% 29.46% Tax Rate 28.46% 29.34% 61% PPE/Sales 82% 40.80% 61.267% Depr n/PPE 4.8% 10.29% 7.35% 6.97% 18.88% NWC/Sales 22.33% 17.50% 16.80% Section 2: Macroeconomic and Industry analysis EagerEngineering, an engineering services provider in Australia, competes with similar companies that are currently listed on the Australian Stock Exchange. Required: 1. Select at least 2 similar companies from the same industry as EagerEngineering. Justify your choice carefully 2. Discuss the following in your own words. Use references where appropriate: a. Performance of the industry over the past 3 years b. Short-term (up to 5 years) outlook for the industry, including identification of two (2) major risk factors and an explanation of how these affect the performance of the industry c. Forecast the short-term growth rate for the industry based on the above information d. Discuss the long-term (beyond 5 years) macroeconomic outlook and use relevant information to forecast the long-term growth rate for the industry
Step by Step Solution
There are 3 Steps involved in it
Step: 1

Get Instant Access to Expert-Tailored Solutions
See step-by-step solutions with expert insights and AI powered tools for academic success
Step: 2

Step: 3
Ace Your Homework with AI
Get the answers you need in no time with our AI-driven, step-by-step assistance
Get Started
Supernatural Provision Living In Financial Freedom
Authors: Joan Hunter, Sid Roth
1st Edition
1641238232, 978-1641238236