Answered step by step
Verified Expert Solution
Question
1 Approved Answer
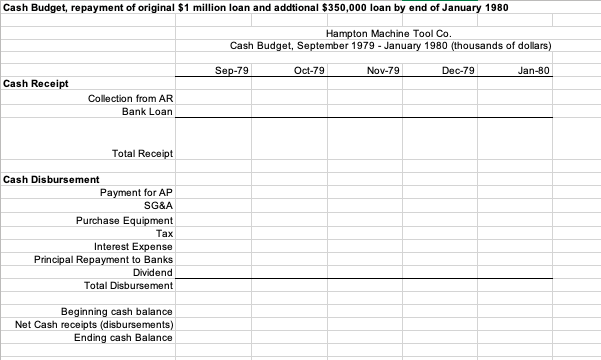
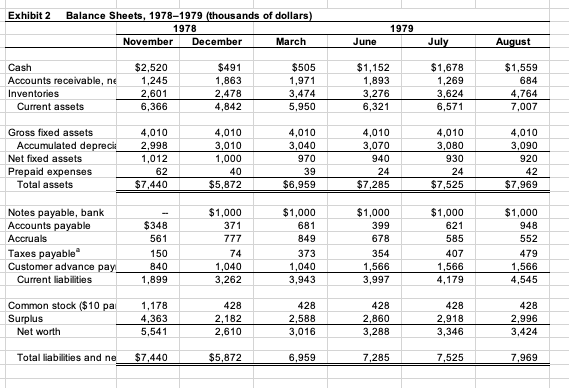
Forecast the cash budget for September 79 - January 80 using the following income statement and balance sheet. Cash Budget, repayment of original $1 million


Forecast the cash budget for September 79 - January 80 using the following income statement and balance sheet.
Cash Budget, repayment of original $1 million loan and addtional $350,000 loan by end of January 1980 Hampton Machine Tool Co. Cash Budget, September 1979 - January 1980 (thousands of dollars) Sep-79 Oct-79 Nov-79 Dec-79 Jan-B0 Cash Receipt Collection from AR Bank Loan Total Receipt Cash Disbursement Payment for AP SG&A Purchase Equipment Tax Interest Expense Principal Repayment to Banks Dividend Total Disbursement Beginning cash balance Net Cash receipts (disbursements) Ending cash Balance Exhibit 3 Income Statements, 1978-1979 (thousands of dollars) Fiscal Year Ending December 1978 Eight Months January February 1979 April March May June July August $7,854 5,052 2,802 $1,551 1,122 429 $861 474 387 $672 369 303 $1,866 1,362 504 $1,566 1,137 429 $873 567 306 $1,620 1,197 423 $723 510 213 $507 276 231 $8,668 5,892 2,796 Net sales Cost of sales Gross profit Selling and administrative expenses Interest expense Net income before taxe Income taxes Net income Dividends 1,296 248 1,506 723 $783 $50 181 87 $94 $25 103 15 269 129 $140 61 15 227 109 $118 205 15 284 136 $148 172 15 242 116 $126 96 15 195 94 $101 130 15 278 133 $145 $100 87 15 111 53 $58 66 15 150 72 $78 920 120 1,756 842 $914 $100 Exhibit 2 Balance Sheets, 1978-1979 (thousands of dollars) 1978 November December March 1979 June July August $491 1,863 Cash Accounts receivable, ne Inventories Current assets $2,520 1,245 2,601 6,366 $505 1,971 3,474 5,950 $1,152 1,893 3,276 6,321 $1,678 1,269 3,624 6,571 $1,559 684 4,764 7.007 2,478 4,842 Gross fixed assets Accumulated depreci Net fixed assets Prepaid expenses Total assets 4,010 2,998 1,012 62 $7,440 4,010 3,010 1,000 40 $5,872 4,010 3,040 970 39 $6,959 4,010 3,070 940 24 $7,285 4,010 3,080 930 24 $7,525 4,010 3,090 920 42 $7,969 Notes payable, bank Accounts payable Accruals Taxes payable Customer advance pay! Current liabilities $348 561 150 840 1,899 $1,000 371 777 74 1,040 3,262 $1,000 681 849 373 1,040 3,943 $1,000 399 678 354 1,566 3.997 $1,000 621 585 407 1,566 4,179 $1,000 948 552 479 1,566 4,545 Common stock ($10 pa Surplus Net worth 1,178 4,363 5,541 428 2,182 2,610 428 2.588 3,016 428 2,860 3,288 428 2,918 3,346 428 2.996 3,424 Total liabilities and ne $7,440 $5,872 6,959 7,285 7,525 7,969 Cash Budget, repayment of original $1 million loan and addtional $350,000 loan by end of January 1980 Hampton Machine Tool Co. Cash Budget, September 1979 - January 1980 (thousands of dollars) Sep-79 Oct-79 Nov-79 Dec-79 Jan-B0 Cash Receipt Collection from AR Bank Loan Total Receipt Cash Disbursement Payment for AP SG&A Purchase Equipment Tax Interest Expense Principal Repayment to Banks Dividend Total Disbursement Beginning cash balance Net Cash receipts (disbursements) Ending cash Balance Exhibit 3 Income Statements, 1978-1979 (thousands of dollars) Fiscal Year Ending December 1978 Eight Months January February 1979 April March May June July August $7,854 5,052 2,802 $1,551 1,122 429 $861 474 387 $672 369 303 $1,866 1,362 504 $1,566 1,137 429 $873 567 306 $1,620 1,197 423 $723 510 213 $507 276 231 $8,668 5,892 2,796 Net sales Cost of sales Gross profit Selling and administrative expenses Interest expense Net income before taxe Income taxes Net income Dividends 1,296 248 1,506 723 $783 $50 181 87 $94 $25 103 15 269 129 $140 61 15 227 109 $118 205 15 284 136 $148 172 15 242 116 $126 96 15 195 94 $101 130 15 278 133 $145 $100 87 15 111 53 $58 66 15 150 72 $78 920 120 1,756 842 $914 $100 Exhibit 2 Balance Sheets, 1978-1979 (thousands of dollars) 1978 November December March 1979 June July August $491 1,863 Cash Accounts receivable, ne Inventories Current assets $2,520 1,245 2,601 6,366 $505 1,971 3,474 5,950 $1,152 1,893 3,276 6,321 $1,678 1,269 3,624 6,571 $1,559 684 4,764 7.007 2,478 4,842 Gross fixed assets Accumulated depreci Net fixed assets Prepaid expenses Total assets 4,010 2,998 1,012 62 $7,440 4,010 3,010 1,000 40 $5,872 4,010 3,040 970 39 $6,959 4,010 3,070 940 24 $7,285 4,010 3,080 930 24 $7,525 4,010 3,090 920 42 $7,969 Notes payable, bank Accounts payable Accruals Taxes payable Customer advance pay! Current liabilities $348 561 150 840 1,899 $1,000 371 777 74 1,040 3,262 $1,000 681 849 373 1,040 3,943 $1,000 399 678 354 1,566 3.997 $1,000 621 585 407 1,566 4,179 $1,000 948 552 479 1,566 4,545 Common stock ($10 pa Surplus Net worth 1,178 4,363 5,541 428 2,182 2,610 428 2.588 3,016 428 2,860 3,288 428 2,918 3,346 428 2.996 3,424 Total liabilities and ne $7,440 $5,872 6,959 7,285 7,525 7,969Step by Step Solution
There are 3 Steps involved in it
Step: 1

Get Instant Access to Expert-Tailored Solutions
See step-by-step solutions with expert insights and AI powered tools for academic success
Step: 2

Step: 3

Ace Your Homework with AI
Get the answers you need in no time with our AI-driven, step-by-step assistance
Get Started


