Answered step by step
Verified Expert Solution
Link Copied!

Question

1 Approved Answer

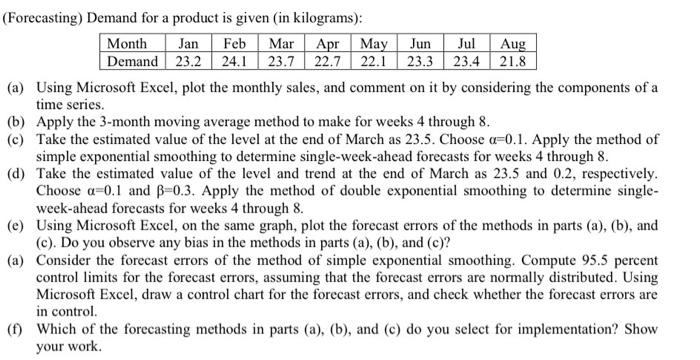
(Forecasting) Demand for a product is given (in kilograms): Month Jan Feb Mar Apr May Jun Jul Aug Demand 23.2 24.1 23.7 22.7 22.1 23.3

(Forecasting) Demand for a product is given (in kilograms): Month Jan Feb Mar Apr May Jun Jul Aug Demand 23.2 24.1 23.7 22.7 22.1 23.3 23.4 21.8 (a) Using Microsoft Excel, plot the monthly sales, and comment on it by considering the components of a time series. (b) Apply the 3-month moving average method to make for weeks 4 through 8. (d) (c) Take the estimated value of the level at the end of March as 23.5. Choose a-0.1. Apply the method of simple exponential smoothing to determine single-week-ahead forecasts for weeks 4 through 8. Take the estimated value of the level and trend at the end of March as 23.5 and 0.2, respectively. Choose a 0.1 and -0.3. Apply the method of double exponential smoothing to determine single- week-ahead forecasts for weeks 4 through 8. (e) Using Microsoft Excel, on the same graph, plot the forecast errors of the methods in parts (a), (b), and (c). Do you observe any bias in the methods in parts (a), (b), and (c)? (a) Consider the forecast errors of the method of simple exponential smoothing. Compute 95.5 percent control limits for the forecast errors, assuming that the forecast errors are normally distributed. Using Microsoft Excel, draw a control chart for the forecast errors, and check whether the forecast errors are in control. (f) Which of the forecasting methods in parts (a), (b), and (c) do you select for implementation? Show your work.
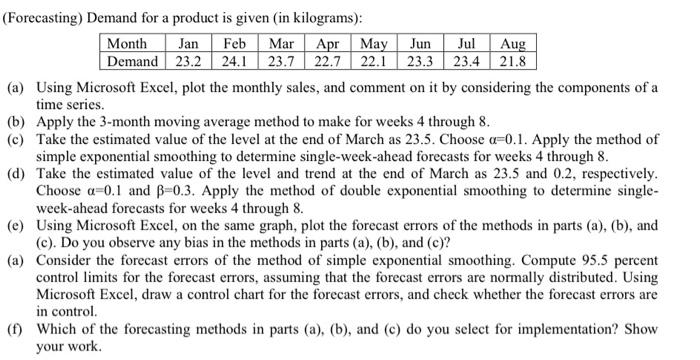
image text in transcribed
(Forecasting) Demand for a product is given (in kilograms): (a) Using Microsoft Excel, plot the monthly sales, and comment on it by considering the components of a time series. (b) Apply the 3-month moving average method to make for weeks 4 through 8 . (c) Take the estimated value of the level at the end of March as 23.5. Choose =0.1. Apply the method of simple exponential smoothing to determine single-week-ahead forecasts for weeks 4 through 8 . (d) Take the estimated value of the level and trend at the end of March as 23.5 and 0.2, respectively. Choose =0.1 and =0.3. Apply the method of double exponential smoothing to determine singleweek-ahead forecasts for weeks 4 through 8 . (e) Using Microsoft Excel, on the same graph, plot the forecast errors of the methods in parts (a), (b), and (c). Do you observe any bias in the methods in parts (a), (b), and (c)? (a) Consider the forecast errors of the method of simple exponential smoothing. Compute 95.5 percent control limits for the forecast errors, assuming that the forecast errors are normally distributed. Using Microsoft Excel, draw a control chart for the forecast errors, and check whether the forecast errors are in control. (f) Which of the forecasting methods in parts (a), (b), and (c) do you select for implementation? Show your work. (Forecasting) Demand for a product is given (in kilograms): (a) Using Microsoft Excel, plot the monthly sales, and comment on it by considering the components of a time series. (b) Apply the 3-month moving average method to make for weeks 4 through 8. (c) Take the estimated value of the level at the end of March as 23.5. Choose =0.1. Apply the method of simple exponential smoothing to determine single-week-ahead forecasts for weeks 4 through 8 . (d) Take the estimated value of the level and trend at the end of March as 23.5 and 0.2 , respectively. Choose =0.1 and =0.3. Apply the method of double exponential smoothing to determine singleweek-ahead forecasts for weeks 4 through 8 . (e) Using Microsoft Excel, on the same graph, plot the forecast errors of the methods in parts (a), (b), and (c). Do you observe any bias in the methods in parts (a), (b), and (c)? (a) Consider the forecast errors of the method of simple exponential smoothing. Compute 95.5 percent control limits for the forecast errors, assuming that the forecast errors are normally distributed. Using Microsoft Excel, draw a control chart for the forecast errors, and check whether the forecast errors are in control. (f) Which of the forecasting methods in parts (a), (b), and (c) do you select for implementation? Show your work
Step by Step Solution

There are 3 Steps involved in it

Step: 1

blur-text-image

Get Instant Access to Expert-Tailored Solutions

See step-by-step solutions with expert insights and AI powered tools for academic success

Step: 2

blur-text-image

Step: 3

blur-text-image

Ace Your Homework with AI

Get the answers you need in no time with our AI-driven, step-by-step assistance

Get Started

Recommended Textbook for

Information Technology Project Management

Authors: Kathy Schwalbe

6th Edition

978-111122175, 1133172393, 9780324786927, 1111221758, 9781133172390, 324786921, 978-1133153726

More Books

Students also viewed these General Management questions

Question

What components are needed for a WLAN?

Answered: 1 week ago