Forecasting with the Parsimonious Method and Estimating Share Value Using the ROPI Model
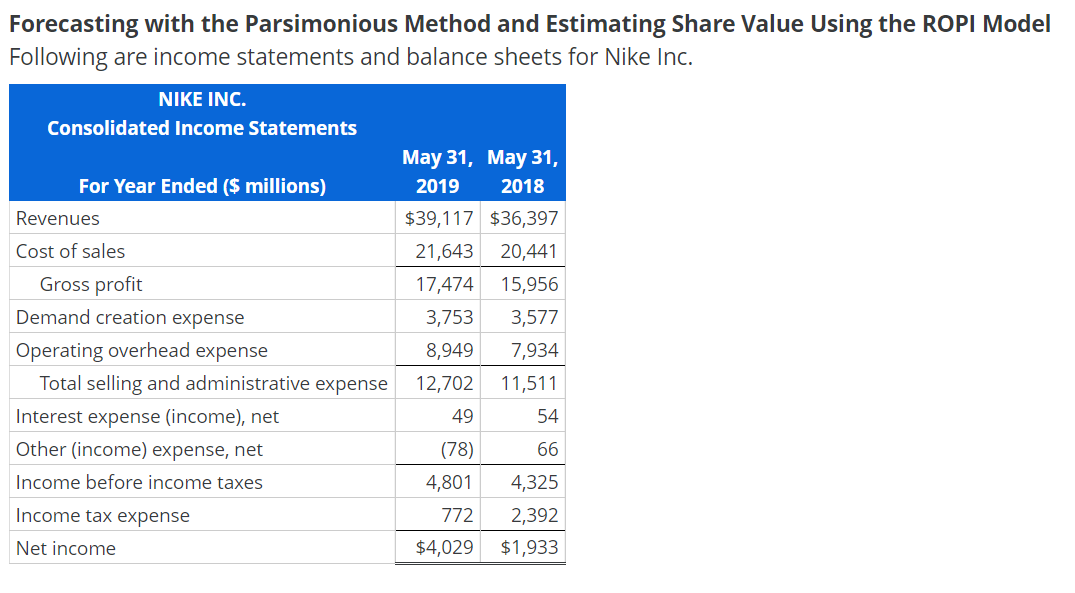
Following are income statements and balance sheets for Nike Inc.
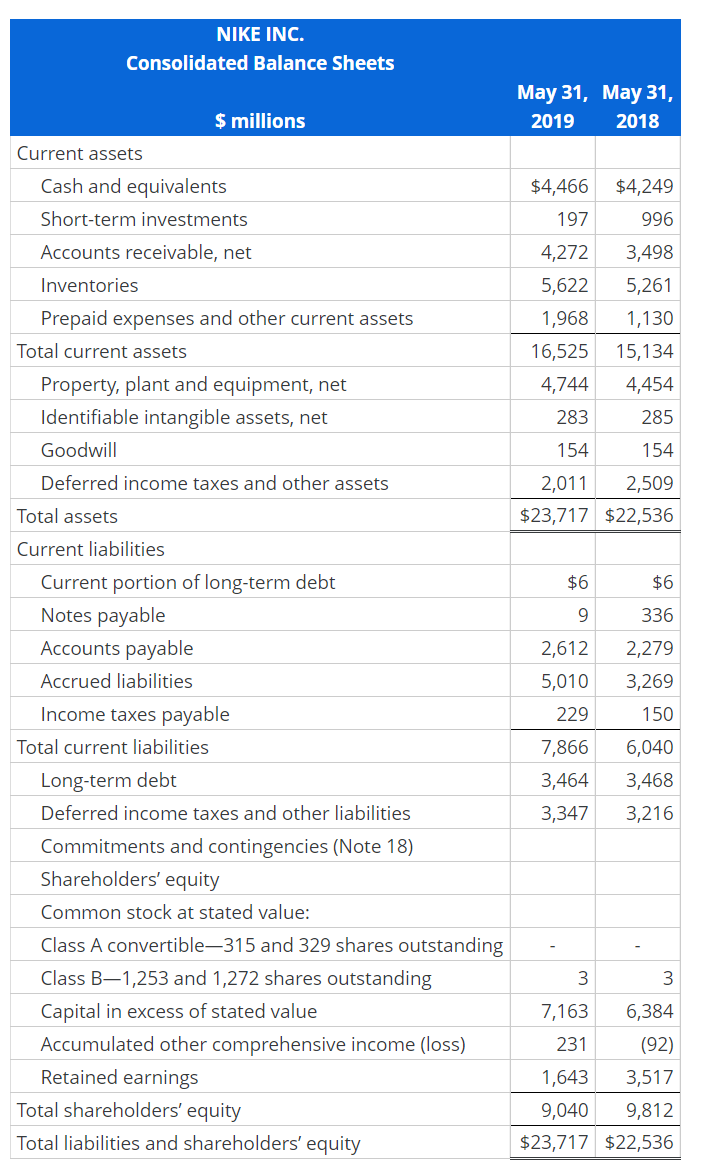
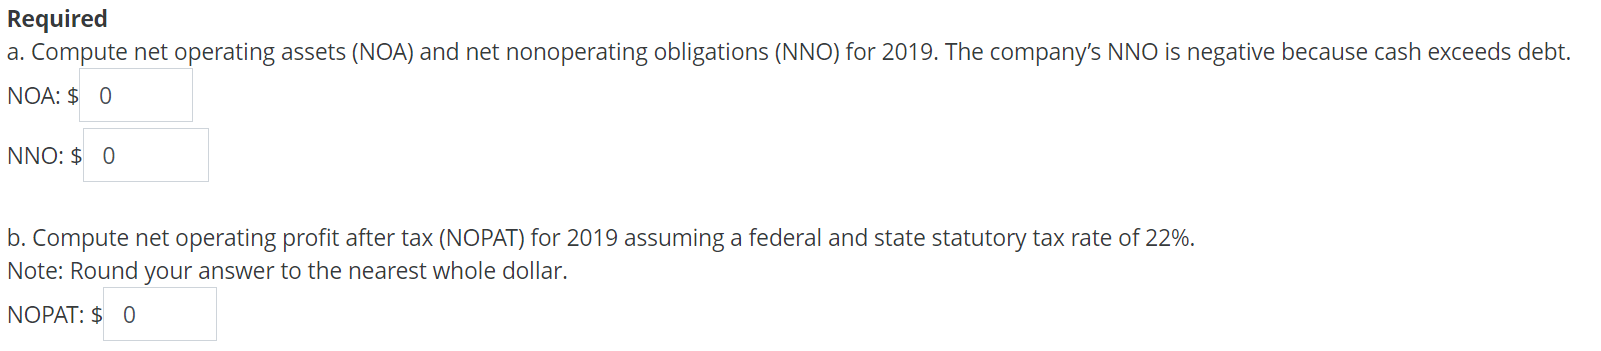
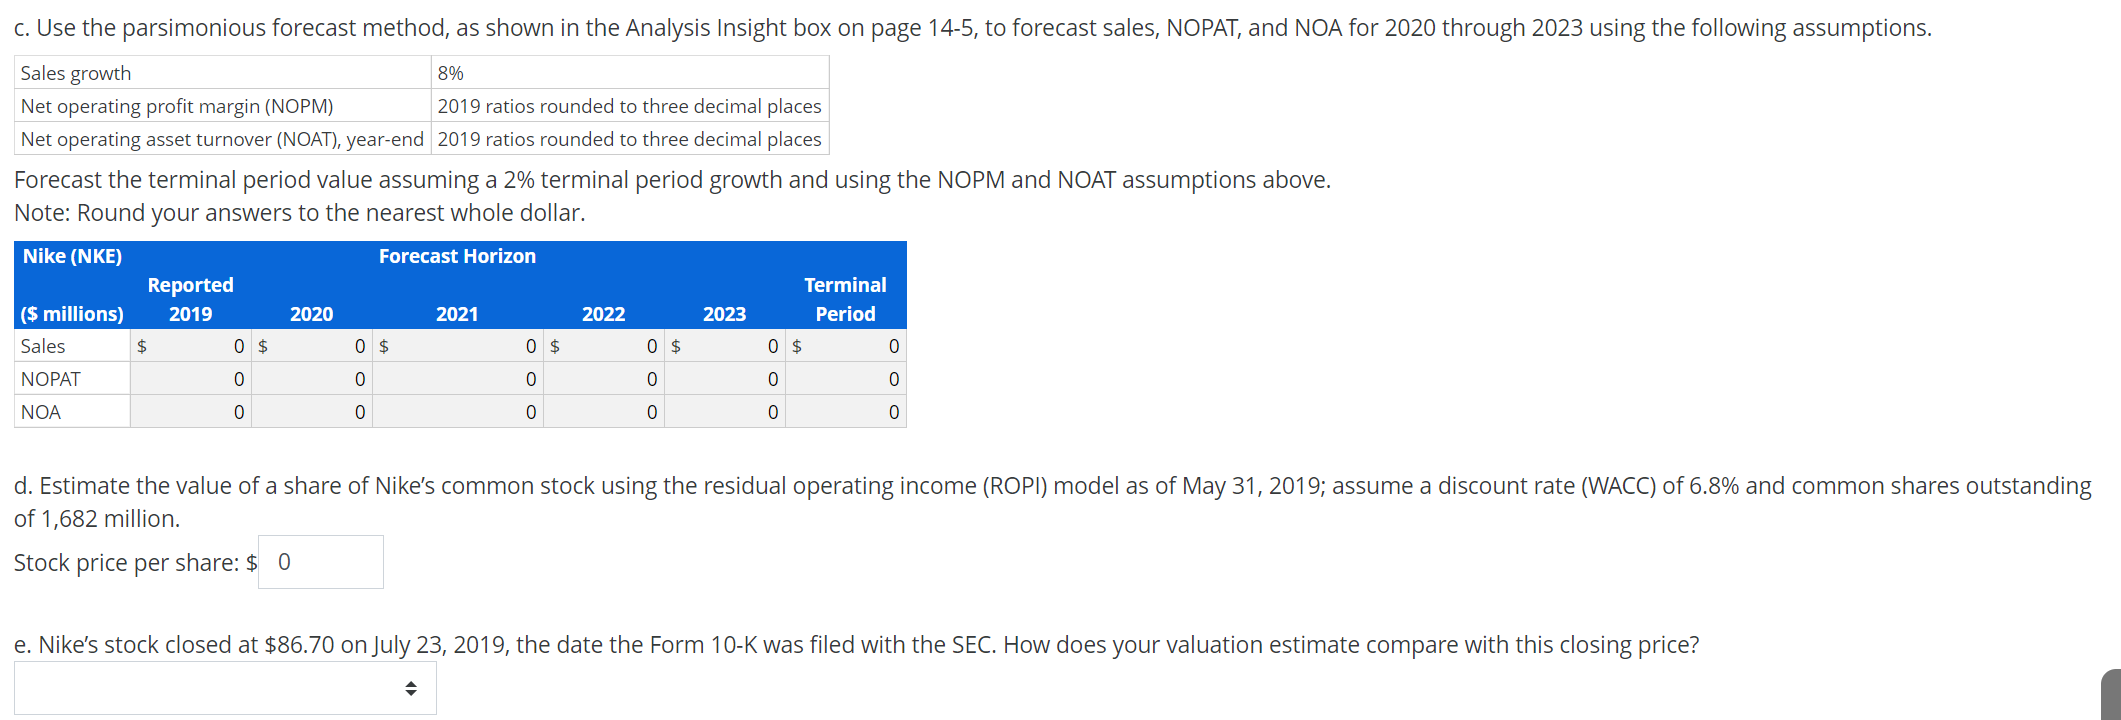
Forecasting with the Parsimonious Method and Estimating Share Value Using the ROPI Model Following are income statements and balance sheets for Nike Inc. NIKE INC. Consolidated Income Statements May 31, For Year Ended ($ millions} 2019 Revenues $39,117 $36,397 Cost of sales 21,643 20,441 Gross prot 17,474 15,956 Demand creation expense 3,753 3,577 Operating overhead expense 8,949 7,934 Total selling and administrative expense 12,702 11,511 Interest expense {income}, net 49 54 Other (income) expense, net {78) 66 Income before income taxes 4,801 4,325 Income tax expense 772 2,392 Net income $4,029 $1,933 NIKE INC. Consolidated Balance Sheets 5 millions Current assets Cash and equivalents Shortterm investments Accounts receivable, net Inventories Prepaid expenses and other current assets Total current assets Property, plant and equipment, net Identiable intangible assets, net Goodwill Deferred income taxes and other assets Total assets Current liabilities Current portion oflongterm debt Notes payable Accounts payable Accrued liabilities Income taxes payable Total current liabilities Longterm debt Deferred income taxes and other liabilities Commitments and contingencies {Note 18) Shareholders' equity Common stock at stated value: Class A convertible31 5 and 329 shares outstanding Class 131253 and 1,272 shares outstanding Capital in excess of stated value Accumulated other comprehensive income (loss) Retained earnings Total shareholders' equity Total liabilities and shareholders' equity $4,466 197 4,272 5,622 1,968 16,525 4,744 283 154 2,011 $23,717 $6 9 2,612 5,01 0 229 7,866 3,464 3,347 3 7,163 231 1 ,643 9,040 $23,717 $4,249 996 3,498 5,261 1,130 15,134 4,454 285 154 2,509 $22,536 $6 336 2,279 3,269 150 6,040 3,468 3,216 3 6,384 {92) 3,517 9,812 $22,536 Required a. Compute net operating assets (NOA) and net nonoperating obligations (NNO) for 2019. The company's NNO is negative because cash exceeds debt. NOA: $ 0 NNO: $ 0 b. Compute net operating profit after tax (NOPAT) for 2019 assuming a federal and state statutory tax rate of 22%. Note: Round your answer to the nearest whole dollar. NOPAT: $ 0c. Use the parsimonious forecast method, as shown in the Analysis Insight box on page 14-5, to forecast sales, NOPAT, and NOA for 2020 through 2023 using the following assumptions. Sales growth 8% Net operating profit margin (NOPM) 2019 ratios rounded to three decimal places Net operating asset turnover {NOAH Veareend 2019 ratios rounded to three decimal places Forecast the terminal period value assuming a 2% terminal period growth and using the NOPM and NOAT assumptions above. Note: Round your answers to the nearest whole dollar. Nike (NKE) Forecast Horizon Reported Terminal (5 millions) 2019 2020 2021 2022 2023 Period Sales $ 0 $ 0 $ 0 $ 0 $ 0 $ 0 NOPAT D D D D D D NOA D D D D D D d. Estimate the value of a share of Nike's common stock using the residual operating income (ROPI) model as of May 31, 2019; assume a discount rate (WACC) of6.8% and common shares outstanding of 1,682 million. Stock price per share: $ 0 e, Nike's stock closed at $86.70 on July 23, 2019, the date the Form 10-K was filed with the SEC, How does your valuation estimate compare with this closing price