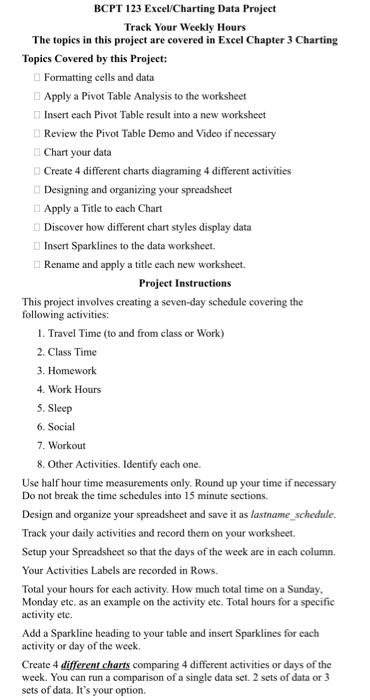
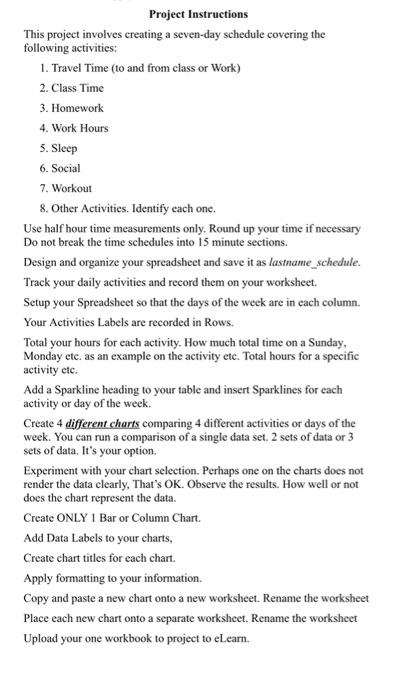
Formatting cells and data Apply a Pivot Table Analysis to the worksheet Insert each Pivot Table result into a new worksheet Review the Pivot Table Demo and Video if necessary Chart your data Create 4 different charts diagraming 4 different activities Designing and organizing your spreadsheet Apply a Title to each Chart Discover how different chart styles display data Insert Sparklines to the data worksheet. Rename and apply a title each new workshect. Project Instructions This project involves creating a seven-day schedule covering the following activities: 1. Travel Time (to and from class or Work) 2. Class Time 3. Homework 4. Work Hours 5. Sleep 6. Social 7. Workout 8. Other Activities. Identify each one. Use half hour time measurements only. Round up your time if necessary Do not break the time schedules into 15 minute sections. Design and organize your spreadsheet and save it as lasthame schedule. Track your daily activities and record them on your worksheet. Setup your Spreadsheet so that the days of the week are in each column. Your Activities Labels are recorded in Rows. Total your hours for each activity. How much total time on a Sunday, Monday etc. as an example on the activity etc. Total hours for a specific activity etc. Add a Sparkline heading to your table and insert Sparklines for each activity or day of the week. Project Instructions This project involves creating a seven-day schedule covering the following activities: 1. Travel Time (to and from class or Work) 2. Class Time 3. Homework 4. Work Hours 5. Sleep 6. Social 7. Workout 8. Other Activities. Identify each one. Use half hour time measurements only. Round up your time if necessary Do not break the time schedules into 15 minute sections. Design and organize your spreadsheet and save it as lastname_schedule. Track your daily activities and record them on your worksheet. Setup your Spreadsheet so that the days of the week are in each column. Your Activities Labels are recorded in Rows. Total your hours for each activity. How much total time on a Sunday, Monday etc. as an example on the activity etc. Total hours for a specific activity etc. Add a Sparkline heading to your table and insert Sparklines for each activity or day of the week. Create 4 different charts comparing 4 different activities or days of the week. You can run a comparison of a single data set. 2 sets of data or 3 sets of data. It's your option. Experiment with your chart selection. Perhaps one on the charts does not render the data clearly, That's OK. Observe the results. How well or not does the chart represent the data. Create ONLY 1 Bar or Column Chart. Add Data Labels to your charts, Create chart titles for each chart. Apply formatting to your information. Copy and paste a new chart onto a new worksheet. Rename the worksheet Place each new chart onto a separate worksheet. Rename the worksheet Upload your one workbook to project to eLearn


