Four page, maximum, report on your answers to questions:
As a loan committee member at the Park Bank, would you approve the request? Why or why not?
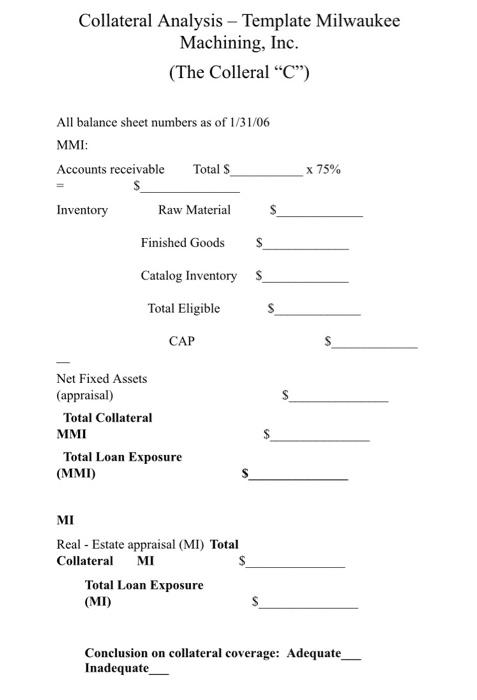
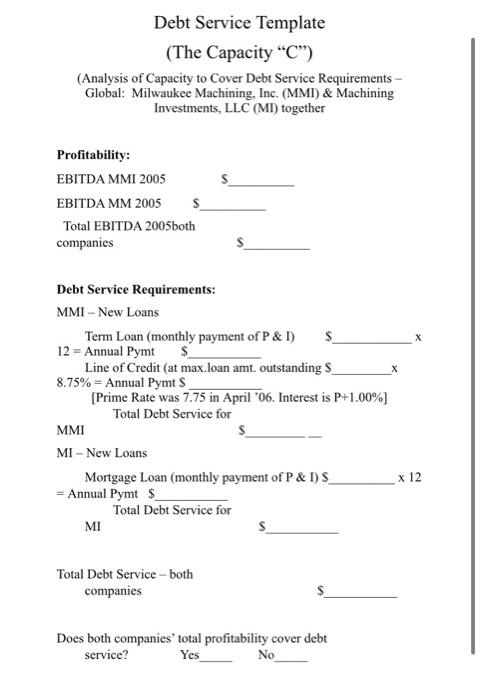
Evaluate the decision using each of the four Cs of credit. Use the Collateral Analysis Template to evaluate the Collateral C. Use the Debt Service Template to evaluate the Capacity C. Templates are below.
The report is to be four pages maximum (the two templates PLUS two word processed pages of discussion making sure you analyze the other two "Cs" of credit).
Consult the Note: DISCUSSION OF BANKING TERMS RELATIVE TO THE MILWAUKEE MACHINING CASE below for interpretation of banker's abbreviations in the bankers loan presentation package.
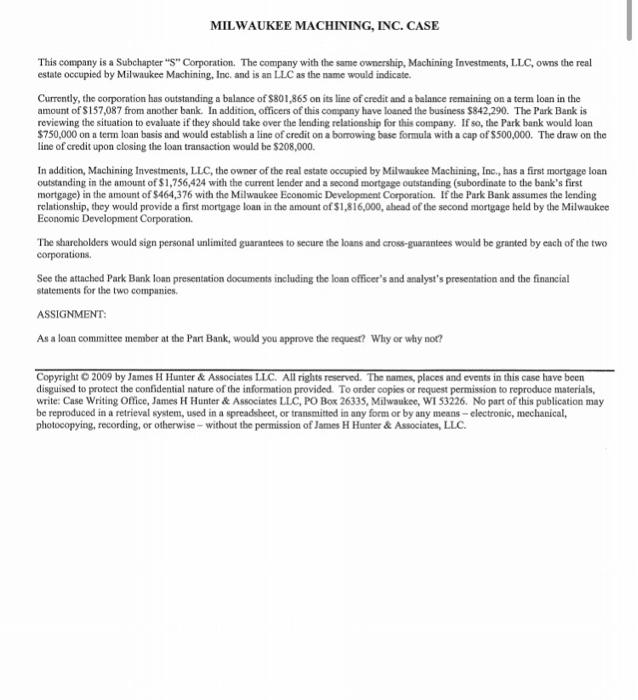
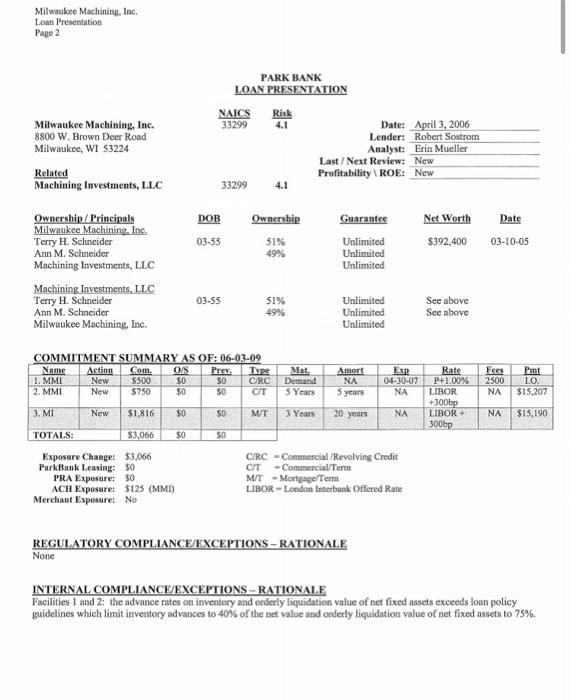
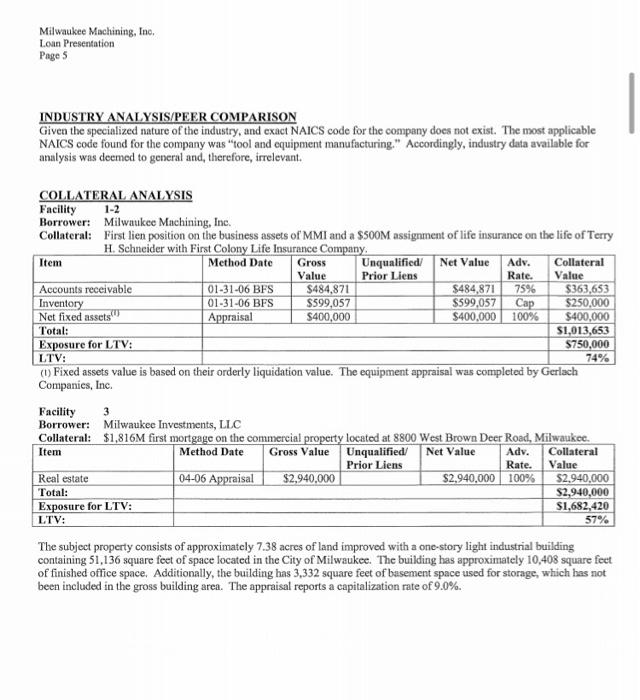
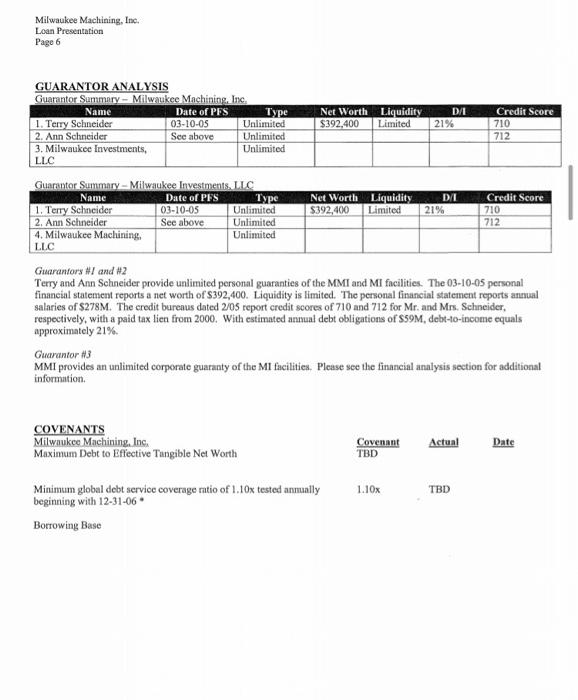
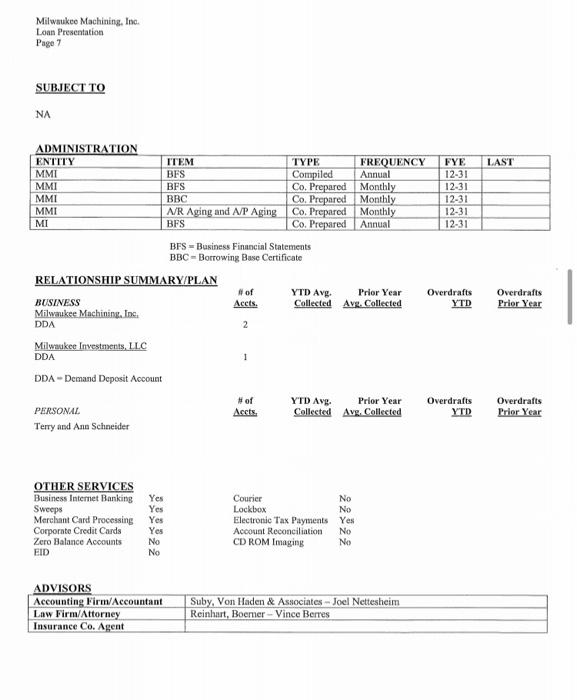
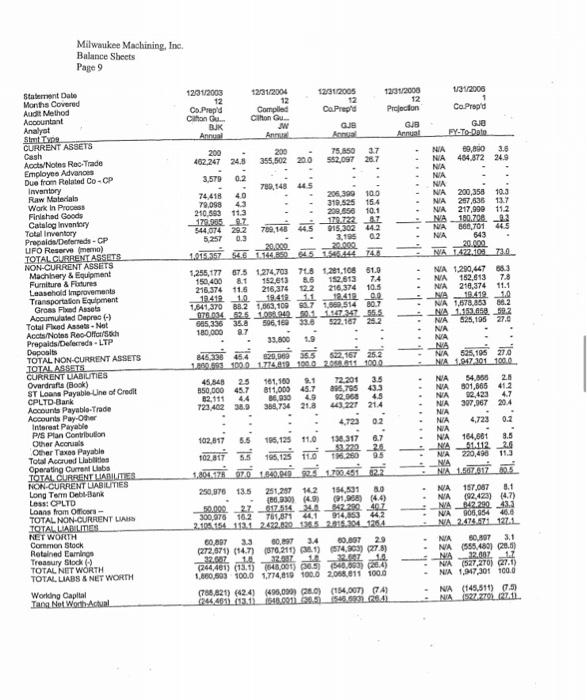
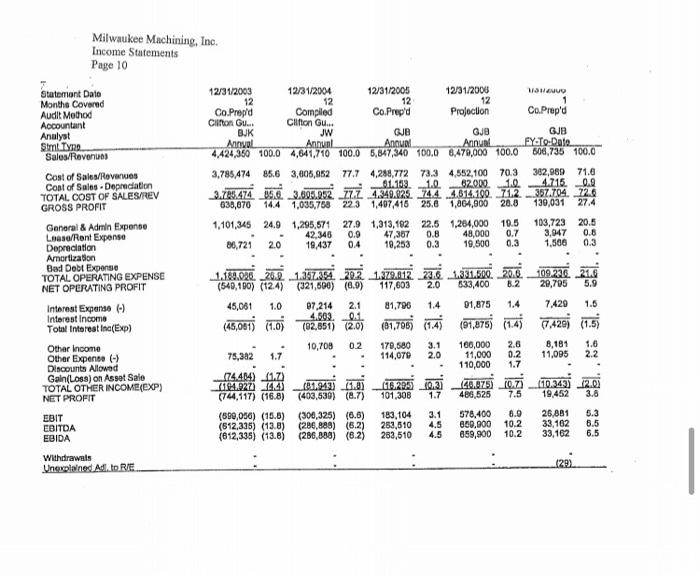
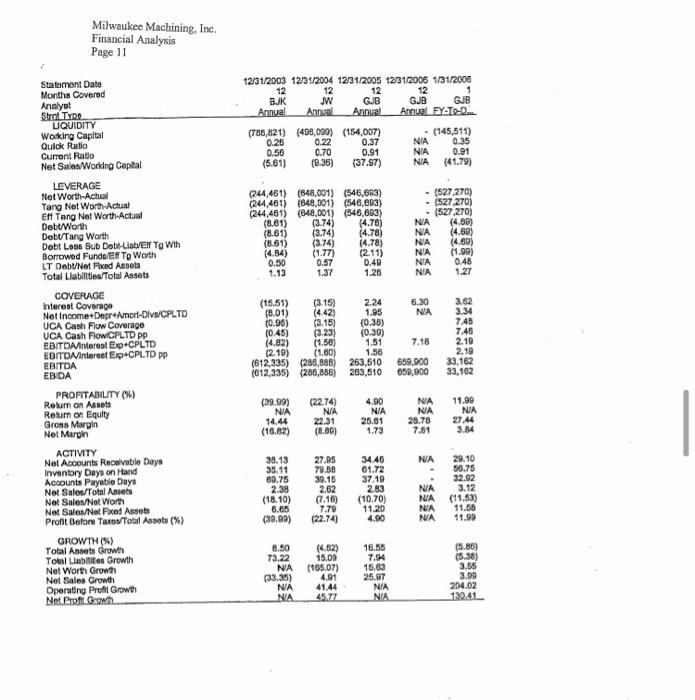
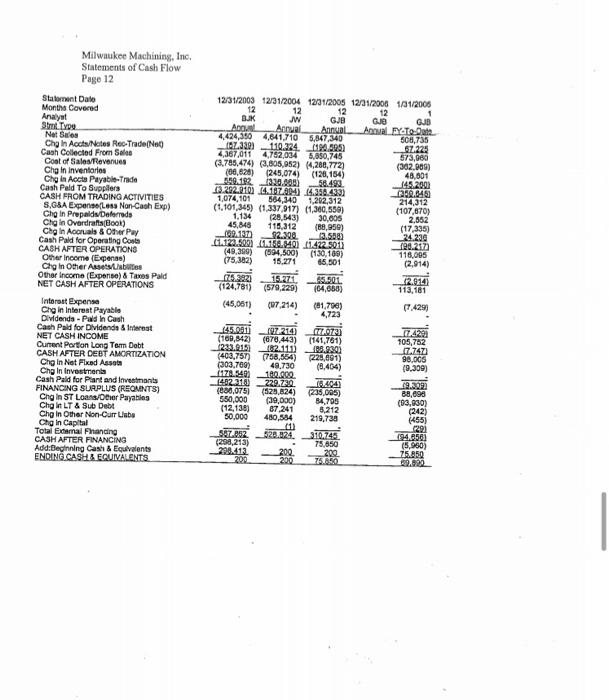
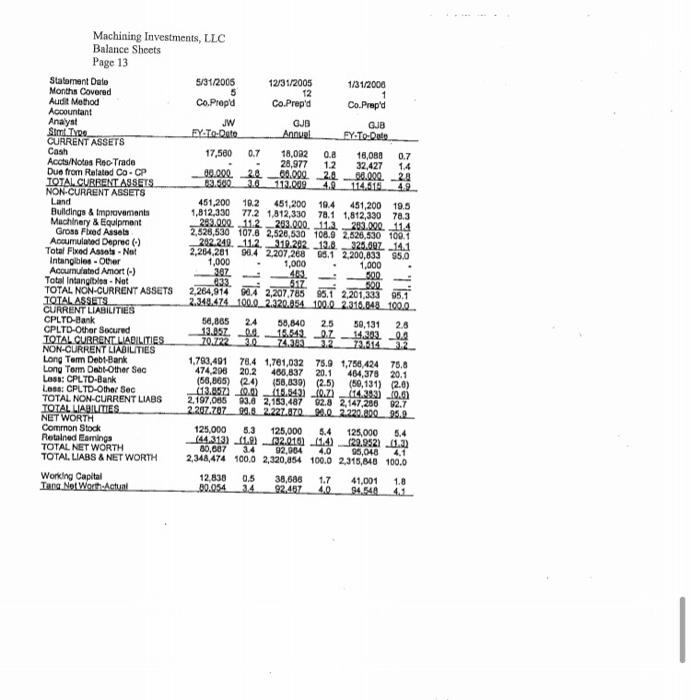
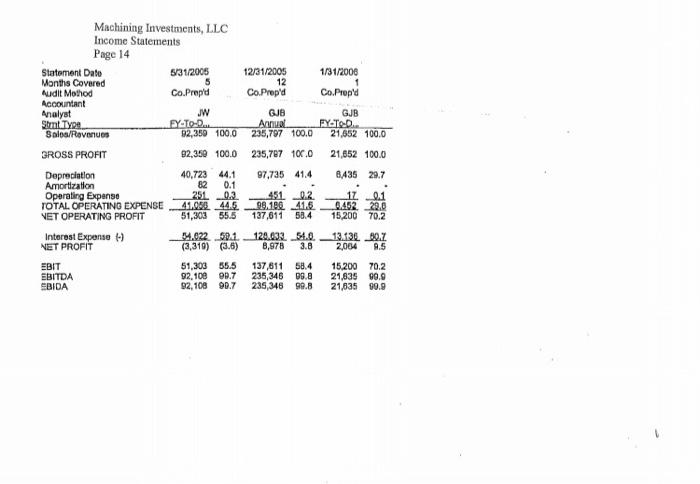
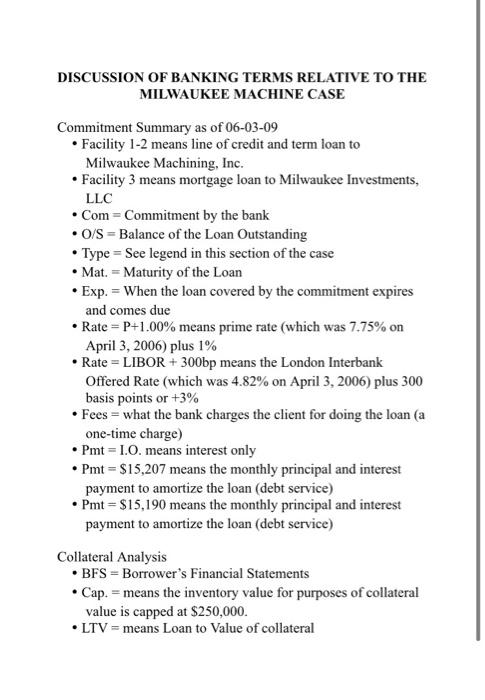
MILWAUKEE MACHINING, INC. CASE This company is a Subchapter "S" Corporation. The company with the same ownership, Machining Investments, LLC, owns the real estate occupied by Milwaukee Machining, Inc. and is an LLC as the name would indicate. Currently, the corporation has outstanding a balance of $801,865 on its line of credit and a balance remaining on a term loan in the amount of $157,087 from another bank. In addition, officers of this company have loaned the business $842,290. The Park Bank is reviewing the situation to evaluate if they should take over the lending relationship for this company. If so, the Park bank would loan $750,000 on a term loan basis and would establish a line of credit on a borrowing base formula with a cup of $500,000. The draw on the line of credit upon closing the loan transaction would be $208,000. In addition, Machining Investments, LLC, the owner of the real estate occupied by Milwaukee Machining, Inc., has a first mortgage loan outstanding in the amount of $1,756,424 with the current lender and a second mortgage outstanding (subordinate to the bank's first mortgage) in the amount of 5464,376 with the Milwaukee Economic Development Corporation. If the Park Bank assumes the lending relationship, they would provide a first mortgage loan in the amount of $1,816,000, ahead of the second mortgage held by the Milwaukee Economic Development Corporation. The shareholders would sign personal unlimited guarantees to secure the loans and cross-guarantees would be granted by each of the two corporations See the attached Park Bank loan presentation documents including the loan officers and analyst's presentation and the financial statements for the two companies. ASSIGNMENT: As a loan committee member at the Part Bank, would you approve the reques? Why or why not? Copyright 2009 by James H Hunter & Associates LLC. All rights reserved. The names, places and events in this case have been disguised to protect the confidential nature of the information provided. To order copies or request permission to reproduce materials, write: Case Writing Office, James H Hunter & Associates LLC, PO Box 26335, Milwaukee, WI 53226. No part of this publication may be reproduced in a retrieval system, used in a spreadsheet, or transmitted in any form or by any means - electronic, mechanical, photocopying, recording, or otherwise - without the permission of James H Hunter & Associates, LLC. Milwaukee Machining, Inc. Loan Presentation Page 2 Milwaukee Machining, Inc. 8800 W. Brown Deer Road Milwaukee, WI 53224 Related Machining Investments, LLC PARK BANK LOAN PRESENTATION NAICS Risk 33299 Date: April 3, 2006 Lender: Robert Sostrom Analyst: Erin Mueller Last/Next Review: New Profitability ROE: New 33299 4.1 DOB Ownership Guarantee Net Worth Date 03-55 51% 49% $392,400 03-10-05 Unlimited Unlimited Unlimited Ownership / Principals Milwaukee Machining, Inc. Terry H. Schneider Ann M. Schneider Machining Investments, LLC Machining Investments, LLC Terry H. Schneider Ann M. Schneider Milwaukee Machining, Inc. 03-55 51% 49% Unlimited Unlimited Unlimited See above See above COMMITMENT SUMMARY AS OF: 06-03-09 Name Action Com Prev Tupe 1. MMI New S500 SO SO C/RC 2. MMI New $750 $ SO CIT Mat. Demand 5 Years Amort NA Exp 04-30-07 NA Fees 2500 NA Rate P+1.00% LIBOR +300bp LIBOR 300bp Pent LO. $15,207 5 years 3. MT New $1,816 SD MT 3 Years 20 years NA NA $15,190 TOTALS: $3,066 $0 SI Exposure Change: $3,066 Park Bank Leasing: 50 PRA Exposure: 50 ACH Exposure: $125 (MMI) Merchant Exposure: No CIRC - Commercial/Revolving Credit CT - Commercial Term M/T-Mortgage Term LIBOR- London Interbank Offered Rate REGULATORY COMPLIANCE/EXCEPTIONS - RATIONALE None INTERNAL COMPLIANCE/EXCEPTIONS - RATIONALE Facilities 1 and 2: the advance rates on inventory and orderly liquidation value of net fixed assets exceeds loan policy guidelines which limit inventory advances to 40% of the niet value and orderly liquidation value of net fixed assets to 75%. Milwaukee Machining, Inc. Loan Presentation Page 5 INDUSTRY ANALYSIS/PEER COMPARISON Given the specialized nature of the industry, and exact NAICS code for the company does not exist. The most applicable NAICS code found for the company was "tool and equipment manufacturing." Accordingly, industry data available for analysis was deemed to general and therefore, irrelevant. COLLATERAL ANALYSIS Facility 1-2 Borrower: Milwaukee Machining, Inc. Collateral: First lien position on the business assets of MMI and a $500M assignment of life insurance on the life of Terry H. Schneider with First Colony Life Insurance Company. Item Method Date Gross Unqualified/ Net Value Adv. Collateral Value Prior Liens Rate. Value Accounts receivable 01-31-06 BFS $484,871 $484,871 75% $363,653 Inventory 01-31-06 BFS $599,057 $599,057 Cap $250.000 Net fixed assets Appraisal $400,000 $400,000 100% $400,000 Total: $1,013,653 Exposure for LTV: $750,000 LTV: 74% (1) Fixed assets value is based on their orderly liquidation value. The equipment appraisal was completed by Gerlach Companies, Inc. Facility 3 Borrower: Milwaukee Investments, LLC Collateral: $1,816M first mortgage on the commercial property located at 8800 West Brown Deer Road, Milwaukee Item Method Date Gross Value Unqualified/ Net Value Adv. Collateral Prior Liens Rate. Value Real estate 04-06 Appraisal $2,940,000 $2,940,000 100% $2,940,000 Total: $2,940,000 Exposure for LTV: $1,682,420 LTV: 57% The subject property consists of approximately 7.38 acres of land improved with a one-story light industrial building containing 51,136 square feet of space located in the City of Milwaukee. The building has approximately 10,408 square feet of finished office space. Additionally, the building has 3,332 square feet of basement space used for storage, which has not been included in the gross building area. The appraisal reports a capitalization rate of 9.0%. Milwaukee Machining, Inc. Loan Presentation Page 6 GUARANTOR ANALYSIS Guarantor Summary - Milwaukee Machining, Inc Name Date of PFS Type 1. Terry Schneider 03-10-05 Unlimited 2. Ann Schneider See above Unlimited 3. Milwaukee Investments, Unlimited LLC Net Worth $392,400 Liquidity Limited D/ 21% Credit Score 710 712 Guarantor Summary - Milwaukee Investments, LLC Name Date of PES Type 1. Terry Schneider 03-10-05 Unlimited 2. Ann Schneider See above Unlimited 4. Milwaukee Machining. Unlimited LLC Net Worth Liquidity $392.400 Limited DI 21% Credit Score 710 712 Guarantory / and #2 Terry and Ann Schneider provide unlimited personal guaranties of the MMI and MI facilities. The 03-10-05 personal financial statement reports a net worth of S392,400. Liquidity is limited. The personal financial statement reports annual salaries of $278M. The credit burenus dated 2/05 report credit scores of 710 and 712 for Mr. and Mrs. Schneider, respectively, with a paid tax lien from 2000. With estimated annual debt obligations of SS9M, debt-to-income equals approximately 21%. Guarantor #3 MMI provides an unlimited corporate guaranty of the Mi facilities. Please see the financial analysis section for additional information COVENANTS Milwnukee Machining, Inc. Maximum Debt to Effective Tangible Net Worth Covenant TBD Actual Date 1.10% TBD Minimum global debt service coverage ratio of 1.10x tested annually beginning with 12-31-06 Borrowing Base Milwaukee Machining, Inc. Loan Presentation Page 7 SUBJECT TO NA LAST ADMINISTRATION ENTITY ITEM TYPE FREQUENCY FYE MMI BFS Compiled Annual 12-31 MMI BFS Co. Prepared Monthly 12-31 MMI BBC Co. Prepared Monthly 12-31 MMI AR Aging and A/P Aging Co. Prepared Monthly 12-31 MI BFS Co. Prepared Annual 12-31 BFS = Business Financial Statements BBC - Borrowing Buse Certificate RELATIONSHIP SUMMARY/PLAN of YTD Avg. Prior Year Overdrafts BUSINESS Acets. Collected Ave. Collected YTD Milwaukee Machining. In DDA 2 Milwaukee Investments, LLC DDA 1 DDA-Demand Deposit Account #of YTD Avg. Prior Year Overdrafts PERSONAL Accts Collected Avg. Collected YTD Terry and Ann Schneider Overdrafts Prior Year Overdrafts Prior Year Yes Yes No OTHER SERVICES Business Internet Banking Sweeps Merchant Card Processing Corporate Credit Cards Zero Balance Accounts EID Yes Courier No Lockbox Electronic Tax Payments Yes Account Reconciliation No CD ROM Imaging No Yes No No ADVISORS Accounting Firm/Accountant Law Firm/Attorney Insurance Co. Agent Suby, Von Haden & Associates - Joel Nettesheim Reinhart, Boemer -Vince Berres Milwaukee Machining, Inc. Balance Sheets Page 9 Statement Date Months Covered Audit Method Accountant Analyst Sim Type CURRENT ASSETS Cash Acts/Notes Rec-Trade Employes Advance Due from Related Co-CP Inventory Raw Materials Work in Pro Finished Goods Catalog Inventory Total Inventory Prepaida Deferreds - GP UFO Reserve (meno) TOTAL CURRENT ASSETS NON-CURRENT ASSETS Machinery & Equipment Furniture & Fixtures Leasehold improvements Transportation Equipment Gross Find Assets Accumulated Deprec (-) Total Fled Assets - Net Accts/Notas Reo Ollot/sch Prepaids/Deferrada - LTP Depools TOTAL NON-CURRENT ASSETS CURRENT LABIUTIES TOTAL ASSETS Overdrafts (Book) ST Loans Payable-Line of Credit CPLTD Bank Accounts Payablo Trade Accounts Pay Other Interest Payable P/s Plan Contribution Other Acorul Other Taxos Payable Total Accrued Liabilities Operating Current Labs TOTAL CURRENT LAILTES NON-CURRENT LABILITIES Long Term Debt-Bank LOSS CPLTD ) Loans from Offios - TOTAL NON-CURRENT LIARS TOTAL LIABILITIES NET WORTH Common Stock Retained Earnings Treasury Stock TOTAL NIT WORTH TOTAL LIABS & NET WORTH Working Capital Tane. Net Worth. Actual 1231/2003 121/2004 12/31/2005 12312000 1/31/2000 12 12 12 12 Co. Prepid Compled Ca. Prepid Projecton Co.Prop'd Chonu.. Cilton Gu BJK JW GJE GJE GJO An Annual FY-To-Date 200 200 75.850 3.7 NIA 10,000 3.6 462.247 248 355,502 200 562,097 267 NA 464.872 24.9 NA 3.579 0.2 NA 789,148 45 NA 74,418 206.390 100 NA 200,358 10.3 79,098 43 310.525 15.4 NIA 257,636 13.7 210.503 113 209.650 10.1 NA 217,990 11.2 544.074 222 788,144.5 15.502 14.3 NA 180.708 2.2 NA 660,701 445 5.257 0.3 2.193 02 NA 643 20.000 22.002 20.000 1.013.557 546 1.144850 45 1546.444 74 NA247210730 1,255,177 67.5 1274.703 768 1.21.108 51.9 NA 1.290,447 68.3 150.400 81 152.13 8.5 152.613 74 NA 152,613 7.8 216.374 116 216,376 216.374 10.5 NA 210,374 11.1 19.412 19.41211 12.412 0.2 NA 19.419 10 1,641.370 63.2 1,003,109 47 1.000.514 80.7 NA 1,678,863 66.2 170.094.525 1.091942901 127 55.5 NA 1.153.05.59.2 665.336 35. a 506.169 3370 522167 202 NA 6.5.195 270 180.000 NA 1.9 NA 84633 5 0,500 368 52.167 252 NA NA 551 1091100017164101020111000 NA 1,947 101 1000 45,848 161,100 72.201 3.5 NA 54.858 2.8 850,000 45.7 811,000 45.7 96.795 43.3 801,066 12.111 44 36,030 4.9 92.068 4.5 NA 12,423 4.7 723 402 36.9 389.734 21.8 443227 214 NA 307,067 204 NIA 4.723 02 NIA 4.723 0.2 NA 102,817 5.5 195,125 11.0 136.317 6.7 NA 164,681 8.5 2 NA 102,817 5.5 195,125 150 51.112 2.0 16.00 95 NA 220,490 11.3 NA 1.804,176 940,00 1700451 NA ZA 250,370 18.5 251.287 12 154,591 8.0 NA 157.087 8.1 10.30 (49 91.988) (4.4) NIA (92,423) (4.7) 50.000 27 017514340142200 401 NA 842.290 43. 300,076 162 TO1,871 4.1 9143442 NA 906,954 40.6 2.10515411312492.820 185 2015.304_1264 NA 2.474.571 1271 60.897 3.3 60. 34 29 NA 50,897 3.1 (272,071) (14.7) 76.211) 08.1) 514.903) (275) NA 555.489) 20.0) 32.887 18 32.82721 22.AZ 1.0 NA 12.002 1.1 244.401) (13.6) 68.001) 340,6031 20.4) NA (527,270) 01.1) 1.000,00 100.0 774,819 100.6 2.068.611 100.6 NIA 1,017,301 100.0 (766,821) (424) (495.000 8.0) (154,00T) (4) NA (145,511) 0.5) 244.401.03.11 640.0011201548.99188.41 NA1527.7 27.11. NA Milwaukee Machining, Inc. Income Statements Page 10 12/31/2003 12/31/2004 12/31/2005 12/31/2000 Wawa 12 12 12 12 1 Co Prepid Compled Co. Prep'd Projection Co.Prop'd Clifton Gu... Clifton Gu... BJK JW QJB GJE GJE Annual Annun Anoul Annual FY.To-Date 4.424,350 100.0 4,641,710 100.0 5,847,340 100.0 6,470,000 100.0 806,735 100.0 3,785,474 85.6 3,606,952 77.7 4,288,772 73,3 4,552,100 70.3 382,989 71.6 4.715 0.2 3.788.474 3.000.052ZL 1.349,023. 74.4 1614100 12302704724 638,070 14.4 1,035,758 223 1,407,416 25.8 1,864,900 20.8 130,031 27.4 1,101,345 24.9 1,295,871 27.9 1,313,182 22.5 1,204,000 10.5 103,723 20.5 42,345 0.9 47,387 0.8 48,000 0.7 3,947 0.8 36,721 2.0 19,437 0.4 19,253 0.3 19.500 0.3 1,500 0.3 Statement Date Monthe Covered Audit Method Accountant Analyst Stml Tyne. Sales/Revenues Cost of Sales/Reveres Cont of Sales - Deprecation TOTAL COST OF SALES/REV GROSS PROFIT General & Admin Expense Lease/Rent Expense Depreciation Amortization Bad Dobt Expono TOTAL OPERATING EXPENSE NET OPERATING PROFIT Interest Expense (-) Interest Income Total Interest Inc(Exp) Other Income Other Expense (-) Discounts Allowed Gain(Loss) on Asset Sale TOTAL OTHER INCOME(EXP) NET PROFIT EBIT EBITDA EBIDA Withdrawals Unexplained Alto RJE 1,100.000 20.0 1.38784. 202 1,979,412. 27,6 1,391,600. 20.0 109.220. 21.6 (540,100) (124) (321,600) (0.9) 117,603 2.0 $33,400 8.2 20,705 5.9 45,061 1.0 07.214 2.1 81,796 1.4 01,875 1.4 7.429 1.5 4.603 0.1 (46,0813 4.6 92,851) 2.05 (61,796) (141 (91,875) (1.4 7.4201 (1.5 10,703 02 170,580 3.1 160,000 2.6 8,181 5.6 75,382 1.7 114,070 2.0 11,000 11,095 2.2 110,000 1.7 174.484) 11.7) 1164.920 14.45 (1949) 2.0) (0.299 0.31 140.975) 10.73 (10.343) 12.02 (744,117) (16.8) (403,530) (8.7) 101,308 1.7 486,525 19,452 3.8 (590,050) (15.8) (306,325) (0.6) 183,104 3.1 578,400 8.0 26,881 5.3 (612,335) (13.8) (286,888) (5.2) 253,510 4.5 850,000 10.2 33,102 6.5 (612,335) (13.6) (286,888) (8.2) 283,510 4.5 859,900 10.2 33,162 6.5 0.2 7.5 1293 Milwaukee Machining, Inc. Financial Analysis Page 11 GJB 12/31/2003 12/31/2004 12/31/2005 12/31/2006 1/31/2006 12 12 12 12 BJK JW G.B GJB Annual Annel Annual Annual FY-TO- (786,821) (498,090) (154,007) (545,511) 0.26 0.22 0.37 0.35 0.70 0.91 NIA 0.91 (5.61) (0.36) (37.97) NIA (41.79) 0.56 Statement Date Months Covered Analyst Strot TYDE LIQUIDITY Working Capital Quick Ratio Current Radio Net Sales Working Capital LEVERAGE Net Worth-Actual Tang Net Worth Actual Ef Tang Net Worth-Actual Debt/Worth Debt/Tang Worth Debt Loss Sub Dobe-Lisb/El To Wth Borrowed Funde Ef To Worth LT Debt Net Fixed Assets Total Liabilities/Total Assets (244,461) (648,001) (546,683) (244,401) (648,001) (546,093) (244,461) (648,001) (546,683) (8.81) (3.74) (4.78) (8.61) (3.74) (4.78) (8.61) (3.74) (4.78) (4.84) (1.77) (2.11) 0.30 0.57 0.49 1.13 1.37 1.28 - (527,270) - (527.270) - (527,270) NA (4.00) NA (4.68) NA (4.80) NA (1.99) NA 0.48 NIA 1.27 6.30 NA (15.51) (3.15) 2.24 (8.01) (4.42) 1.95 (0.96) (3.15) (0.35) (0.45) (3.23) 10.30) (4.82) 11.58) 1.51 (2.10) (1.60) 1.56 (612,335) (286,88B) 263,510 (012,335) (206,868) 263,510 7.18 3.62 3.34 7.45 7.40 2.10 2.19 33,162 33,162 650.000 650,900 (39.99) NA 14.44 (16.62) (22.74) NA 22.31 (8.80) 4.00 NA 25.01 NA NA 28.78 7.51 11.89 NA 27.44 3.14 1.73 COVERAGE Interest Coverage Not Income DepreAmort-Dlvs/CPLTD UCA Cash Flow Coverage UCA Cash Flow CPLTD PP EBITDA Interest Exp.CPLTD EDITOAInterest Exp+CPLTD PP EBITDA EBIDA PROFITABILITY (%) Rolumn on Assets Return on Equity Gross Margin Net Marpin ACTIVITY Not Accounts Receivable Days Inventory Days on Hand Accounts Payable Days Net Sales/Total Assets Net Sales Net Worth Net Salas/Net Foxed Assets Profit Boforo Taros Total Assets (%) GROWTH (%) Total Annets Growth Touluablites Growth Net Worth Growth Net Sales Growth Operating Profit Growth Net Pro Gh NA 38.13 35.11 60.75 2.38 (18.10) 6.65 (39.99) 27.95 79.38 39.15 2.62 (7.16) 7.70 (22.74) 34.40 61.72 37.10 2.83 (10.70) 11.20 4.90 NA NIA NA NA 20.10 50.75 32.92 3.12 (11.53) 11.50 11.9D 8.50 73.22 NA (33.35) NA NA (4.62) 15.00 (165,07) 4.91 41.44 16.55 7.94 15.69 25.97 NIA NA (5.85) (5.38) 3.55 3.99 204.02 130.41 45.22 Milwaukee Machining, Inc. Statements of Cash Flow Page 12 Statement Date Months Covered Analyst Stml Type Net Sales Chain Acts/Notes Rec-Trade/Ne) Cash Collected From Seleo Coat of Sales Revenues Chg In inventarios Cho in Acta Payable-Trade Cash Pald To Suppliers CASH FROM TRADING ACTIVITIES S,GSA ExpensLess Non-Cash Exp) Chain Propalds Deferredo Chg in Overdraftstoot) Chain Accruals & Other Pay Cash Pald for Operating Costs CASH AFTER OPERATIONS Other Income (Expense) Chg in Other Assets abuses Other Income (Expense) & Taxes Pald NET CASH AFTER OPERATIONS Interest Expense Che in Interest Payable Dividends - Pwd in Cash Cash Pald for Dividends & Invest NET CASH INCOME Current Porton Long Term Debt CASH AFTER DEBT AMORTIZATION Che In Net Fixed Asset Cha In Investments Cash Pald for Plant and Investments FINANCING SURPLUS (REQMNTS) Chain ST Loans Other Payaties Chain LT & Sub Debt Cho in Other Non-Curr Usbe Chg in Capital Total External handing CASH AFTER FINANCING Add:Beginning Cash & Equivalents ENDING. CASH EQUIVALENTS 12/31/2003 12/31/2004 12/31/2005 12/31/2006 1131/2006 12 12 12 12 BJK JW GJB GJE GJB ADOL Anrvel Annual Anaval FyTo Date 4,424,350 4,641,710 5,347,340 508,735 17.220) 110.224. 1194.595) 67.223 2,367,011 4.762,034 6.650,745 573,080 (3.785,474) (3.605,952) 4.268,772) (302.909) (66,628) (245,074) (128,154) 48,601 6.90.192 58.490 145.200 13.202.010) 4.107.804 4.344.433 250.640 1,074,101 564,340 1,202,312 214,312 (1.101,345) (1.337 917) (1,340,550) (107,870) 1.134 (25,543) 30.006 2,552 45.848 118,312 (88,950) (17,335) 02.137 92.300 3.500 24.290 c122.500.0 11.422.5013 199.2172 (49.390) (594,500) (130,100) 116,095 (75,382) 15.271 65,501 (2,914) 79.3921 15.271 (124781) (579,229) 104,658) 113,161 (45,067) (07,214) (81,7961 (7.429) 4.723 ISSOT 17.4291 105,752 7.747 98.0GS (9.309) (169,842) 1233.915 (403,757) (303.769) 117.94 148220 (880,0751 550,000 (12,136) 30,000 Sez.002 (298,213) 290.412 200 197 214 (678,443) 02.111 (758,554) 49.730 180.000 229.230 (525,824) (39,000) 87,241 480,554 520.024 200 200 2.0723 (141,761) LPA 230 228,891 (0.404) 10.44 (235,005) 84,795 8.212 219.738 310,745 75,650 200 76.50 19.309 88,898 (03,030) (242) (455) 1291 194 (5.950) 75.850 0.7 Machining Investments, LLC Balance Sheets Page 13 Statement Date 5/31/2005 12/31/2005 1/31/2000 Months Covered 5 12 1 Audit Method Co.Propd Co.Prep'd Co.Prap'd Accountant Analyst JW GJD GJB Sim. Type FYTO-Date Annuel EY.To Date CURRENT ASSETS Cash 17,500 0.7 18,092 0.8 16,080 Accts/Notes Rec Trade 28,977 1.2 32,427 Due from Related Co-CP 99.000. 2.2 89.000 2.290.009 20 TOTAL.CURRENT ASSETS 333.500 20 112.009 4.9 114.518 NON-CURRENT ASSETS Land 451,200 10.2 451,200 19.4 451,200 19.5 Bulldings & Improvements 1,812,330 77.2 1,812,330 78.1 1,812,330 70.3 Machinery & Equipment 293.000 11.2 209.000. 11.2. 283.000 114 Gross Fixed Assets 2,526,530 107.8 2,526,530 108.9 2,526,530 100.1 Accumulated Deprec) 282.240. 11.2. 319.202. 13. 325.697 14.1 Total Fixed Assat - Net 2,264,201 90.4 2,207,268 68.1 2.200,833 55.0 Intangibles - Oler 1,000 1,000 1,000 Acourulated Amort (-) 30Z 463 500 Total Intangibles. Not 517 500 TOTAL NON-CURRENT ASSETS 2,264,914 4 2,207,785 95.1 2.201 333 95.1 TOTAL ASSETS 2.349.474_100.0 2.320.054 100.0 2.310.849100.0 CURRENT LIABILITIES CPLTD-Bank 50,885 24 58,840 2.5 50,131 2.8 CPLTD Other Secured 13.05. D. 16.842 OZ 14,302 0.2 TOTAL.CURRENT LIADILITIES 70.72230 7.3.273.61432 NON-CURRENT LIABILITIES Long Term Debt-Bank 1.793,491 78.4 1,701,032 75.9 1,788,424 75.8 Long Term Dabl-Other Sec 474,296 20.2 480,837 20.1 464,378 20.1 Loss: CPLTD-Bank (58,865) (24) (50,039) (2.5) (50,131) (2.0) Los: CPLTD-Other Sec (13.857 10.0110.543 10.2 114.393) 100 TOTAL NON-CURRENT LIABS 2. 197,065 3.0 2,153,487 2.8 2,147,286 02.7 TOTAL LIABILITIES 2.207.707_90.0.2.227.270.22.220.00098.2 NET WORTH Common Stock 125,000 5.3 125,000 125,000 5.4 Retained Lamings (44.313) 11.9 2.0.10) 11.4) 122.9521 0.22 TOTAL NET WORTH 80,607 3.4 92,084 4.0 96,048 4.1 TOTAI, LIABS & NET WORTH 2,348,474 100.0 2,320,854 100.0 2,315,848 100.0 Working Capital 12,838 0.5 38,686 1.7 41,001 1.8 Tang.NoLWoctActual 30.054 3.4 92,407 40 5449 12/31/2005 12 Co.Prep'd 1/31/2006 Co.Prop'd GJB GJB Annual FOTO 235,797 100.0 21,652 100.0 Machining Investments, LLC Income Statements Page 14 Statement Date 5/31/2005 Months Covered 5 Audit Mothod Co.Prepid Accountant Analyst JW Strnt Type FY-TO-DL Salos/Ravenues 92,350 100.0 3ROSS PROFIT 92,350 100.0 Depreciation 40.723 44.1 Amortization 82 0.1 Operating Expense 251 0.3 TOTAL OPERATINO EXPENSE 41.065 44.5 NET OPERATING PROFIT 51,303 Interest Expense (-) 14.022 50.1 NET PROFIT (3,319) (3.6) EBIT 51,303 55.5 EBITDA 92,10 99.7 SBIDA 92,108 90.7 235,707 106.0 21,652 100.0 97,735 41.4 8,435 29.7 451 0.2 99.182 41.6 137,611 58.4 17. 0.1 8.452_29.6 15,200 70.2 55.5 129.632 54.6. 8,978 3.8 13.136 90.7 2,004 R.5 137,611 235,346 235,346 58.4 D9 8 99.8 15.200 70.2 21,835 99.9 21,835 99.9 DISCUSSION OF BANKING TERMS RELATIVE TO THE MILWAUKEE MACHINE CASE Commitment Summary as of 06-03-09 Facility 1-2 means line of credit and term loan to Milwaukee Machining, Inc. Facility 3 means mortgage loan to Milwaukee Investments, LLC . Com = Commitment by the bank O/S= Balance of the Loan Outstanding Type = See legend in this section of the case Mat. = Maturity of the Loan Exp. = When the loan covered by the commitment expires and comes due Rate = P+1.00% means prime rate (which was 7.75% on April 3, 2006) plus 1% Rate = LIBOR + 300bp means the London Interbank Offered Rate (which was 4.82% on April 3, 2006) plus 300 basis points or +3% Fees = what the bank charges the client for doing the loan (a one-time charge) Pmt = 1.0. means interest only Pmt = $15,207 means the monthly principal and interest payment to amortize the loan (debt service) Pmt = $15,190 means the monthly principal and interest payment to amortize the loan (debt service) Collateral Analysis BFS = Borrower's Financial Statements Cap. = means the inventory value for purposes of collateral value is capped at $250,000. LTV = means Loan to Value of collateral Collateral Analysis - Template Milwaukee Machining, Inc. (The Colleral "C") All balance sheet numbers as of 1/31/06 MMI: Accounts receivable Total x 75% Inventory Raw Material S Finished Goods Catalog Inventory $ Total Eligible CAP Net Fixed Assets (appraisal) Total Collateral MMI Total Loan Exposure (MMI) MI Real - Estate appraisal (MI) Total Collateral MI $ Total Loan Exposure (MI) Conclusion on collateral coverage: Adequate Inadequate Debt Service Template (The Capacity "C") (Analysis of Capacity to Cover Debt Service Requirements - Global: Milwaukee Machining, Inc. (MMI) & Machining Investments, LLC (MI) together Profitability: EBITDA MMI 2005 EBITDA MM 2005 Total EBITDA 2005both companies Debt Service Requirements: MMI - New Loans Term Loan (monthly payment of P&I) 12 = Annual Pymt Line of Credit (at max.loan amt. outstanding S 8.75% = Annual Pymt $ [Prime Rate was 7.75 in April '06. Interest is P+1.00%) Total Debt Service for MMI MI - New Loans Mortgage Loan (monthly payment of P&D) S = Annual Pymt $ Total Debt Service for MI $ x 12 Total Debt Service - both companies Does both companies total profitability cover debt service? Yes No MILWAUKEE MACHINING, INC. CASE This company is a Subchapter "S" Corporation. The company with the same ownership, Machining Investments, LLC, owns the real estate occupied by Milwaukee Machining, Inc. and is an LLC as the name would indicate. Currently, the corporation has outstanding a balance of $801,865 on its line of credit and a balance remaining on a term loan in the amount of $157,087 from another bank. In addition, officers of this company have loaned the business $842,290. The Park Bank is reviewing the situation to evaluate if they should take over the lending relationship for this company. If so, the Park bank would loan $750,000 on a term loan basis and would establish a line of credit on a borrowing base formula with a cup of $500,000. The draw on the line of credit upon closing the loan transaction would be $208,000. In addition, Machining Investments, LLC, the owner of the real estate occupied by Milwaukee Machining, Inc., has a first mortgage loan outstanding in the amount of $1,756,424 with the current lender and a second mortgage outstanding (subordinate to the bank's first mortgage) in the amount of 5464,376 with the Milwaukee Economic Development Corporation. If the Park Bank assumes the lending relationship, they would provide a first mortgage loan in the amount of $1,816,000, ahead of the second mortgage held by the Milwaukee Economic Development Corporation. The shareholders would sign personal unlimited guarantees to secure the loans and cross-guarantees would be granted by each of the two corporations See the attached Park Bank loan presentation documents including the loan officers and analyst's presentation and the financial statements for the two companies. ASSIGNMENT: As a loan committee member at the Part Bank, would you approve the reques? Why or why not? Copyright 2009 by James H Hunter & Associates LLC. All rights reserved. The names, places and events in this case have been disguised to protect the confidential nature of the information provided. To order copies or request permission to reproduce materials, write: Case Writing Office, James H Hunter & Associates LLC, PO Box 26335, Milwaukee, WI 53226. No part of this publication may be reproduced in a retrieval system, used in a spreadsheet, or transmitted in any form or by any means - electronic, mechanical, photocopying, recording, or otherwise - without the permission of James H Hunter & Associates, LLC. Milwaukee Machining, Inc. Loan Presentation Page 2 Milwaukee Machining, Inc. 8800 W. Brown Deer Road Milwaukee, WI 53224 Related Machining Investments, LLC PARK BANK LOAN PRESENTATION NAICS Risk 33299 Date: April 3, 2006 Lender: Robert Sostrom Analyst: Erin Mueller Last/Next Review: New Profitability ROE: New 33299 4.1 DOB Ownership Guarantee Net Worth Date 03-55 51% 49% $392,400 03-10-05 Unlimited Unlimited Unlimited Ownership / Principals Milwaukee Machining, Inc. Terry H. Schneider Ann M. Schneider Machining Investments, LLC Machining Investments, LLC Terry H. Schneider Ann M. Schneider Milwaukee Machining, Inc. 03-55 51% 49% Unlimited Unlimited Unlimited See above See above COMMITMENT SUMMARY AS OF: 06-03-09 Name Action Com Prev Tupe 1. MMI New S500 SO SO C/RC 2. MMI New $750 $ SO CIT Mat. Demand 5 Years Amort NA Exp 04-30-07 NA Fees 2500 NA Rate P+1.00% LIBOR +300bp LIBOR 300bp Pent LO. $15,207 5 years 3. MT New $1,816 SD MT 3 Years 20 years NA NA $15,190 TOTALS: $3,066 $0 SI Exposure Change: $3,066 Park Bank Leasing: 50 PRA Exposure: 50 ACH Exposure: $125 (MMI) Merchant Exposure: No CIRC - Commercial/Revolving Credit CT - Commercial Term M/T-Mortgage Term LIBOR- London Interbank Offered Rate REGULATORY COMPLIANCE/EXCEPTIONS - RATIONALE None INTERNAL COMPLIANCE/EXCEPTIONS - RATIONALE Facilities 1 and 2: the advance rates on inventory and orderly liquidation value of net fixed assets exceeds loan policy guidelines which limit inventory advances to 40% of the niet value and orderly liquidation value of net fixed assets to 75%. Milwaukee Machining, Inc. Loan Presentation Page 5 INDUSTRY ANALYSIS/PEER COMPARISON Given the specialized nature of the industry, and exact NAICS code for the company does not exist. The most applicable NAICS code found for the company was "tool and equipment manufacturing." Accordingly, industry data available for analysis was deemed to general and therefore, irrelevant. COLLATERAL ANALYSIS Facility 1-2 Borrower: Milwaukee Machining, Inc. Collateral: First lien position on the business assets of MMI and a $500M assignment of life insurance on the life of Terry H. Schneider with First Colony Life Insurance Company. Item Method Date Gross Unqualified/ Net Value Adv. Collateral Value Prior Liens Rate. Value Accounts receivable 01-31-06 BFS $484,871 $484,871 75% $363,653 Inventory 01-31-06 BFS $599,057 $599,057 Cap $250.000 Net fixed assets Appraisal $400,000 $400,000 100% $400,000 Total: $1,013,653 Exposure for LTV: $750,000 LTV: 74% (1) Fixed assets value is based on their orderly liquidation value. The equipment appraisal was completed by Gerlach Companies, Inc. Facility 3 Borrower: Milwaukee Investments, LLC Collateral: $1,816M first mortgage on the commercial property located at 8800 West Brown Deer Road, Milwaukee Item Method Date Gross Value Unqualified/ Net Value Adv. Collateral Prior Liens Rate. Value Real estate 04-06 Appraisal $2,940,000 $2,940,000 100% $2,940,000 Total: $2,940,000 Exposure for LTV: $1,682,420 LTV: 57% The subject property consists of approximately 7.38 acres of land improved with a one-story light industrial building containing 51,136 square feet of space located in the City of Milwaukee. The building has approximately 10,408 square feet of finished office space. Additionally, the building has 3,332 square feet of basement space used for storage, which has not been included in the gross building area. The appraisal reports a capitalization rate of 9.0%. Milwaukee Machining, Inc. Loan Presentation Page 6 GUARANTOR ANALYSIS Guarantor Summary - Milwaukee Machining, Inc Name Date of PFS Type 1. Terry Schneider 03-10-05 Unlimited 2. Ann Schneider See above Unlimited 3. Milwaukee Investments, Unlimited LLC Net Worth $392,400 Liquidity Limited D/ 21% Credit Score 710 712 Guarantor Summary - Milwaukee Investments, LLC Name Date of PES Type 1. Terry Schneider 03-10-05 Unlimited 2. Ann Schneider See above Unlimited 4. Milwaukee Machining. Unlimited LLC Net Worth Liquidity $392.400 Limited DI 21% Credit Score 710 712 Guarantory / and #2 Terry and Ann Schneider provide unlimited personal guaranties of the MMI and MI facilities. The 03-10-05 personal financial statement reports a net worth of S392,400. Liquidity is limited. The personal financial statement reports annual salaries of $278M. The credit burenus dated 2/05 report credit scores of 710 and 712 for Mr. and Mrs. Schneider, respectively, with a paid tax lien from 2000. With estimated annual debt obligations of SS9M, debt-to-income equals approximately 21%. Guarantor #3 MMI provides an unlimited corporate guaranty of the Mi facilities. Please see the financial analysis section for additional information COVENANTS Milwnukee Machining, Inc. Maximum Debt to Effective Tangible Net Worth Covenant TBD Actual Date 1.10% TBD Minimum global debt service coverage ratio of 1.10x tested annually beginning with 12-31-06 Borrowing Base Milwaukee Machining, Inc. Loan Presentation Page 7 SUBJECT TO NA LAST ADMINISTRATION ENTITY ITEM TYPE FREQUENCY FYE MMI BFS Compiled Annual 12-31 MMI BFS Co. Prepared Monthly 12-31 MMI BBC Co. Prepared Monthly 12-31 MMI AR Aging and A/P Aging Co. Prepared Monthly 12-31 MI BFS Co. Prepared Annual 12-31 BFS = Business Financial Statements BBC - Borrowing Buse Certificate RELATIONSHIP SUMMARY/PLAN of YTD Avg. Prior Year Overdrafts BUSINESS Acets. Collected Ave. Collected YTD Milwaukee Machining. In DDA 2 Milwaukee Investments, LLC DDA 1 DDA-Demand Deposit Account #of YTD Avg. Prior Year Overdrafts PERSONAL Accts Collected Avg. Collected YTD Terry and Ann Schneider Overdrafts Prior Year Overdrafts Prior Year Yes Yes No OTHER SERVICES Business Internet Banking Sweeps Merchant Card Processing Corporate Credit Cards Zero Balance Accounts EID Yes Courier No Lockbox Electronic Tax Payments Yes Account Reconciliation No CD ROM Imaging No Yes No No ADVISORS Accounting Firm/Accountant Law Firm/Attorney Insurance Co. Agent Suby, Von Haden & Associates - Joel Nettesheim Reinhart, Boemer -Vince Berres Milwaukee Machining, Inc. Balance Sheets Page 9 Statement Date Months Covered Audit Method Accountant Analyst Sim Type CURRENT ASSETS Cash Acts/Notes Rec-Trade Employes Advance Due from Related Co-CP Inventory Raw Materials Work in Pro Finished Goods Catalog Inventory Total Inventory Prepaida Deferreds - GP UFO Reserve (meno) TOTAL CURRENT ASSETS NON-CURRENT ASSETS Machinery & Equipment Furniture & Fixtures Leasehold improvements Transportation Equipment Gross Find Assets Accumulated Deprec (-) Total Fled Assets - Net Accts/Notas Reo Ollot/sch Prepaids/Deferrada - LTP Depools TOTAL NON-CURRENT ASSETS CURRENT LABIUTIES TOTAL ASSETS Overdrafts (Book) ST Loans Payable-Line of Credit CPLTD Bank Accounts Payablo Trade Accounts Pay Other Interest Payable P/s Plan Contribution Other Acorul Other Taxos Payable Total Accrued Liabilities Operating Current Labs TOTAL CURRENT LAILTES NON-CURRENT LABILITIES Long Term Debt-Bank LOSS CPLTD ) Loans from Offios - TOTAL NON-CURRENT LIARS TOTAL LIABILITIES NET WORTH Common Stock Retained Earnings Treasury Stock TOTAL NIT WORTH TOTAL LIABS & NET WORTH Working Capital Tane. Net Worth. Actual 1231/2003 121/2004 12/31/2005 12312000 1/31/2000 12 12 12 12 Co. Prepid Compled Ca. Prepid Projecton Co.Prop'd Chonu.. Cilton Gu BJK JW GJE GJE GJO An Annual FY-To-Date 200 200 75.850 3.7 NIA 10,000 3.6 462.247 248 355,502 200 562,097 267 NA 464.872 24.9 NA 3.579 0.2 NA 789,148 45 NA 74,418 206.390 100 NA 200,358 10.3 79,098 43 310.525 15.4 NIA 257,636 13.7 210.503 113 209.650 10.1 NA 217,990 11.2 544.074 222 788,144.5 15.502 14.3 NA 180.708 2.2 NA 660,701 445 5.257 0.3 2.193 02 NA 643 20.000 22.002 20.000 1.013.557 546 1.144850 45 1546.444 74 NA247210730 1,255,177 67.5 1274.703 768 1.21.108 51.9 NA 1.290,447 68.3 150.400 81 152.13 8.5 152.613 74 NA 152,613 7.8 216.374 116 216,376 216.374 10.5 NA 210,374 11.1 19.412 19.41211 12.412 0.2 NA 19.419 10 1,641.370 63.2 1,003,109 47 1.000.514 80.7 NA 1,678,863 66.2 170.094.525 1.091942901 127 55.5 NA 1.153.05.59.2 665.336 35. a 506.169 3370 522167 202 NA 6.5.195 270 180.000 NA 1.9 NA 84633 5 0,500 368 52.167 252 NA NA 551 1091100017164101020111000 NA 1,947 101 1000 45,848 161,100 72.201 3.5 NA 54.858 2.8 850,000 45.7 811,000 45.7 96.795 43.3 801,066 12.111 44 36,030 4.9 92.068 4.5 NA 12,423 4.7 723 402 36.9 389.734 21.8 443227 214 NA 307,067 204 NIA 4.723 02 NIA 4.723 0.2 NA 102,817 5.5 195,125 11.0 136.317 6.7 NA 164,681 8.5 2 NA 102,817 5.5 195,125 150 51.112 2.0 16.00 95 NA 220,490 11.3 NA 1.804,176 940,00 1700451 NA ZA 250,370 18.5 251.287 12 154,591 8.0 NA 157.087 8.1 10.30 (49 91.988) (4.4) NIA (92,423) (4.7) 50.000 27 017514340142200 401 NA 842.290 43. 300,076 162 TO1,871 4.1 9143442 NA 906,954 40.6 2.10515411312492.820 185 2015.304_1264 NA 2.474.571 1271 60.897 3.3 60. 34 29 NA 50,897 3.1 (272,071) (14.7) 76.211) 08.1) 514.903) (275) NA 555.489) 20.0) 32.887 18 32.82721 22.AZ 1.0 NA 12.002 1.1 244.401) (13.6) 68.001) 340,6031 20.4) NA (527,270) 01.1) 1.000,00 100.0 774,819 100.6 2.068.611 100.6 NIA 1,017,301 100.0 (766,821) (424) (495.000 8.0) (154,00T) (4) NA (145,511) 0.5) 244.401.03.11 640.0011201548.99188.41 NA1527.7 27.11. NA Milwaukee Machining, Inc. Income Statements Page 10 12/31/2003 12/31/2004 12/31/2005 12/31/2000 Wawa 12 12 12 12 1 Co Prepid Compled Co. Prep'd Projection Co.Prop'd Clifton Gu... Clifton Gu... BJK JW QJB GJE GJE Annual Annun Anoul Annual FY.To-Date 4.424,350 100.0 4,641,710 100.0 5,847,340 100.0 6,470,000 100.0 806,735 100.0 3,785,474 85.6 3,606,952 77.7 4,288,772 73,3 4,552,100 70.3 382,989 71.6 4.715 0.2 3.788.474 3.000.052ZL 1.349,023. 74.4 1614100 12302704724 638,070 14.4 1,035,758 223 1,407,416 25.8 1,864,900 20.8 130,031 27.4 1,101,345 24.9 1,295,871 27.9 1,313,182 22.5 1,204,000 10.5 103,723 20.5 42,345 0.9 47,387 0.8 48,000 0.7 3,947 0.8 36,721 2.0 19,437 0.4 19,253 0.3 19.500 0.3 1,500 0.3 Statement Date Monthe Covered Audit Method Accountant Analyst Stml Tyne. Sales/Revenues Cost of Sales/Reveres Cont of Sales - Deprecation TOTAL COST OF SALES/REV GROSS PROFIT General & Admin Expense Lease/Rent Expense Depreciation Amortization Bad Dobt Expono TOTAL OPERATING EXPENSE NET OPERATING PROFIT Interest Expense (-) Interest Income Total Interest Inc(Exp) Other Income Other Expense (-) Discounts Allowed Gain(Loss) on Asset Sale TOTAL OTHER INCOME(EXP) NET PROFIT EBIT EBITDA EBIDA Withdrawals Unexplained Alto RJE 1,100.000 20.0 1.38784. 202 1,979,412. 27,6 1,391,600. 20.0 109.220. 21.6 (540,100) (124) (321,600) (0.9) 117,603 2.0 $33,400 8.2 20,705 5.9 45,061 1.0 07.214 2.1 81,796 1.4 01,875 1.4 7.429 1.5 4.603 0.1 (46,0813 4.6 92,851) 2.05 (61,796) (141 (91,875) (1.4 7.4201 (1.5 10,703 02 170,580 3.1 160,000 2.6 8,181 5.6 75,382 1.7 114,070 2.0 11,000 11,095 2.2 110,000 1.7 174.484) 11.7) 1164.920 14.45 (1949) 2.0) (0.299 0.31 140.975) 10.73 (10.343) 12.02 (744,117) (16.8) (403,530) (8.7) 101,308 1.7 486,525 19,452 3.8 (590,050) (15.8) (306,325) (0.6) 183,104 3.1 578,400 8.0 26,881 5.3 (612,335) (13.8) (286,888) (5.2) 253,510 4.5 850,000 10.2 33,102 6.5 (612,335) (13.6) (286,888) (8.2) 283,510 4.5 859,900 10.2 33,162 6.5 0.2 7.5 1293 Milwaukee Machining, Inc. Financial Analysis Page 11 GJB 12/31/2003 12/31/2004 12/31/2005 12/31/2006 1/31/2006 12 12 12 12 BJK JW G.B GJB Annual Annel Annual Annual FY-TO- (786,821) (498,090) (154,007) (545,511) 0.26 0.22 0.37 0.35 0.70 0.91 NIA 0.91 (5.61) (0.36) (37.97) NIA (41.79) 0.56 Statement Date Months Covered Analyst Strot TYDE LIQUIDITY Working Capital Quick Ratio Current Radio Net Sales Working Capital LEVERAGE Net Worth-Actual Tang Net Worth Actual Ef Tang Net Worth-Actual Debt/Worth Debt/Tang Worth Debt Loss Sub Dobe-Lisb/El To Wth Borrowed Funde Ef To Worth LT Debt Net Fixed Assets Total Liabilities/Total Assets (244,461) (648,001) (546,683) (244,401) (648,001) (546,093) (244,461) (648,001) (546,683) (8.81) (3.74) (4.78) (8.61) (3.74) (4.78) (8.61) (3.74) (4.78) (4.84) (1.77) (2.11) 0.30 0.57 0.49 1.13 1.37 1.28 - (527,270) - (527.270) - (527,270) NA (4.00) NA (4.68) NA (4.80) NA (1.99) NA 0.48 NIA 1.27 6.30 NA (15.51) (3.15) 2.24 (8.01) (4.42) 1.95 (0.96) (3.15) (0.35) (0.45) (3.23) 10.30) (4.82) 11.58) 1.51 (2.10) (1.60) 1.56 (612,335) (286,88B) 263,510 (012,335) (206,868) 263,510 7.18 3.62 3.34 7.45 7.40 2.10 2.19 33,162 33,162 650.000 650,900 (39.99) NA 14.44 (16.62) (22.74) NA 22.31 (8.80) 4.00 NA 25.01 NA NA 28.78 7.51 11.89 NA 27.44 3.14 1.73 COVERAGE Interest Coverage Not Income DepreAmort-Dlvs/CPLTD UCA Cash Flow Coverage UCA Cash Flow CPLTD PP EBITDA Interest Exp.CPLTD EDITOAInterest Exp+CPLTD PP EBITDA EBIDA PROFITABILITY (%) Rolumn on Assets Return on Equity Gross Margin Net Marpin ACTIVITY Not Accounts Receivable Days Inventory Days on Hand Accounts Payable Days Net Sales/Total Assets Net Sales Net Worth Net Salas/Net Foxed Assets Profit Boforo Taros Total Assets (%) GROWTH (%) Total Annets Growth Touluablites Growth Net Worth Growth Net Sales Growth Operating Profit Growth Net Pro Gh NA 38.13 35.11 60.75 2.38 (18.10) 6.65 (39.99) 27.95 79.38 39.15 2.62 (7.16) 7.70 (22.74) 34.40 61.72 37.10 2.83 (10.70) 11.20 4.90 NA NIA NA NA 20.10 50.75 32.92 3.12 (11.53) 11.50 11.9D 8.50 73.22 NA (33.35) NA NA (4.62) 15.00 (165,07) 4.91 41.44 16.55 7.94 15.69 25.97 NIA NA (5.85) (5.38) 3.55 3.99 204.02 130.41 45.22 Milwaukee Machining, Inc. Statements of Cash Flow Page 12 Statement Date Months Covered Analyst Stml Type Net Sales Chain Acts/Notes Rec-Trade/Ne) Cash Collected From Seleo Coat of Sales Revenues Chg In inventarios Cho in Acta Payable-Trade Cash Pald To Suppliers CASH FROM TRADING ACTIVITIES S,GSA ExpensLess Non-Cash Exp) Chain Propalds Deferredo Chg in Overdraftstoot) Chain Accruals & Other Pay Cash Pald for Operating Costs CASH AFTER OPERATIONS Other Income (Expense) Chg in Other Assets abuses Other Income (Expense) & Taxes Pald NET CASH AFTER OPERATIONS Interest Expense Che in Interest Payable Dividends - Pwd in Cash Cash Pald for Dividends & Invest NET CASH INCOME Current Porton Long Term Debt CASH AFTER DEBT AMORTIZATION Che In Net Fixed Asset Cha In Investments Cash Pald for Plant and Investments FINANCING SURPLUS (REQMNTS) Chain ST Loans Other Payaties Chain LT & Sub Debt Cho in Other Non-Curr Usbe Chg in Capital Total External handing CASH AFTER FINANCING Add:Beginning Cash & Equivalents ENDING. CASH EQUIVALENTS 12/31/2003 12/31/2004 12/31/2005 12/31/2006 1131/2006 12 12 12 12 BJK JW GJB GJE GJB ADOL Anrvel Annual Anaval FyTo Date 4,424,350 4,641,710 5,347,340 508,735 17.220) 110.224. 1194.595) 67.223 2,367,011 4.762,034 6.650,745 573,080 (3.785,474) (3.605,952) 4.268,772) (302.909) (66,628) (245,074) (128,154) 48,601 6.90.192 58.490 145.200 13.202.010) 4.107.804 4.344.433 250.640 1,074,101 564,340 1,202,312 214,312 (1.101,345) (1.337 917) (1,340,550) (107,870) 1.134 (25,543) 30.006 2,552 45.848 118,312 (88,950) (17,335) 02.137 92.300 3.500 24.290 c122.500.0 11.422.5013 199.2172 (49.390) (594,500) (130,100) 116,095 (75,382) 15.271 65,501 (2,914) 79.3921 15.271 (124781) (579,229) 104,658) 113,161 (45,067) (07,214) (81,7961 (7.429) 4.723 ISSOT 17.4291 105,752 7.747 98.0GS (9.309) (169,842) 1233.915 (403,757) (303.769) 117.94 148220 (880,0751 550,000 (12,136) 30,000 Sez.002 (298,213) 290.412 200 197 214 (678,443) 02.111 (758,554) 49.730 180.000 229.230 (525,824) (39,000) 87,241 480,554 520.024 200 200 2.0723 (141,761) LPA 230 228,891 (0.404) 10.44 (235,005) 84,795 8.212 219.738 310,745 75,650 200 76.50 19.309 88,898 (03,030) (242) (455) 1291 194 (5.950) 75.850 0.7 Machining Investments, LLC Balance Sheets Page 13 Statement Date 5/31/2005 12/31/2005 1/31/2000 Months Covered 5 12 1 Audit Method Co.Propd Co.Prep'd Co.Prap'd Accountant Analyst JW GJD GJB Sim. Type FYTO-Date Annuel EY.To Date CURRENT ASSETS Cash 17,500 0.7 18,092 0.8 16,080 Accts/Notes Rec Trade 28,977 1.2 32,427 Due from Related Co-CP 99.000. 2.2 89.000 2.290.009 20 TOTAL.CURRENT ASSETS 333.500 20 112.009 4.9 114.518 NON-CURRENT ASSETS Land 451,200 10.2 451,200 19.4 451,200 19.5 Bulldings & Improvements 1,812,330 77.2 1,812,330 78.1 1,812,330 70.3 Machinery & Equipment 293.000 11.2 209.000. 11.2. 283.000 114 Gross Fixed Assets 2,526,530 107.8 2,526,530 108.9 2,526,530 100.1 Accumulated Deprec) 282.240. 11.2. 319.202. 13. 325.697 14.1 Total Fixed Assat - Net 2,264,201 90.4 2,207,268 68.1 2.200,833 55.0 Intangibles - Oler 1,000 1,000 1,000 Acourulated Amort (-) 30Z 463 500 Total Intangibles. Not 517 500 TOTAL NON-CURRENT ASSETS 2,264,914 4 2,207,785 95.1 2.201 333 95.1 TOTAL ASSETS 2.349.474_100.0 2.320.054 100.0 2.310.849100.0 CURRENT LIABILITIES CPLTD-Bank 50,885 24 58,840 2.5 50,131 2.8 CPLTD Other Secured 13.05. D. 16.842 OZ 14,302 0.2 TOTAL.CURRENT LIADILITIES 70.72230 7.3.273.61432 NON-CURRENT LIABILITIES Long Term Debt-Bank 1.793,491 78.4 1,701,032 75.9 1,788,424 75.8 Long Term Dabl-Other Sec 474,296 20.2 480,837 20.1 464,378 20.1 Loss: CPLTD-Bank (58,865) (24) (50,039) (2.5) (50,131) (2.0) Los: CPLTD-Other Sec (13.857 10.0110.543 10.2 114.393) 100 TOTAL NON-CURRENT LIABS 2. 197,065 3.0 2,153,487 2.8 2,147,286 02.7 TOTAL LIABILITIES 2.207.707_90.0.2.227.270.22.220.00098.2 NET WORTH Common Stock 125,000 5.3 125,000 125,000 5.4 Retained Lamings (44.313) 11.9 2.0.10) 11.4) 122.9521 0.22 TOTAL NET WORTH 80,607 3.4 92,084 4.0 96,048 4.1 TOTAI, LIABS & NET WORTH 2,348,474 100.0 2,320,854 100.0 2,315,848 100.0 Working Capital 12,838 0.5 38,686 1.7 41,001 1.8 Tang.NoLWoctActual 30.054 3.4 92,407 40 5449 12/31/2005 12 Co.Prep'd 1/31/2006 Co.Prop'd GJB GJB Annual FOTO 235,797 100.0 21,652 100.0 Machining Investments, LLC Income Statements Page 14 Statement Date 5/31/2005 Months Covered 5 Audit Mothod Co.Prepid Accountant Analyst JW Strnt Type FY-TO-DL Salos/Ravenues 92,350 100.0 3ROSS PROFIT 92,350 100.0 Depreciation 40.723 44.1 Amortization 82 0.1 Operating Expense 251 0.3 TOTAL OPERATINO EXPENSE 41.065 44.5 NET OPERATING PROFIT 51,303 Interest Expense (-) 14.022 50.1 NET PROFIT (3,319) (3.6) EBIT 51,303 55.5 EBITDA 92,10 99.7 SBIDA 92,108 90.7 235,707 106.0 21,652 100.0 97,735 41.4 8,435 29.7 451 0.2 99.182 41.6 137,611 58.4 17. 0.1 8.452_29.6 15,200 70.2 55.5 129.632 54.6. 8,978 3.8 13.136 90.7 2,004 R.5 137,611 235,346 235,346 58.4 D9 8 99.8 15.200 70.2 21,835 99.9 21,835 99.9 DISCUSSION OF BANKING TERMS RELATIVE TO THE MILWAUKEE MACHINE CASE Commitment Summary as of 06-03-09 Facility 1-2 means line of credit and term loan to Milwaukee Machining, Inc. Facility 3 means mortgage loan to Milwaukee Investments, LLC . Com = Commitment by the bank O/S= Balance of the Loan Outstanding Type = See legend in this section of the case Mat. = Maturity of the Loan Exp. = When the loan covered by the commitment expires and comes due Rate = P+1.00% means prime rate (which was 7.75% on April 3, 2006) plus 1% Rate = LIBOR + 300bp means the London Interbank Offered Rate (which was 4.82% on April 3, 2006) plus 300 basis points or +3% Fees = what the bank charges the client for doing the loan (a one-time charge) Pmt = 1.0. means interest only Pmt = $15,207 means the monthly principal and interest payment to amortize the loan (debt service) Pmt = $15,190 means the monthly principal and interest payment to amortize the loan (debt service) Collateral Analysis BFS = Borrower's Financial Statements Cap. = means the inventory value for purposes of collateral value is capped at $250,000. LTV = means Loan to Value of collateral Collateral Analysis - Template Milwaukee Machining, Inc. (The Colleral "C") All balance sheet numbers as of 1/31/06 MMI: Accounts receivable Total x 75% Inventory Raw Material S Finished Goods Catalog Inventory $ Total Eligible CAP Net Fixed Assets (appraisal) Total Collateral MMI Total Loan Exposure (MMI) MI Real - Estate appraisal (MI) Total Collateral MI $ Total Loan Exposure (MI) Conclusion on collateral coverage: Adequate Inadequate Debt Service Template (The Capacity "C") (Analysis of Capacity to Cover Debt Service Requirements - Global: Milwaukee Machining, Inc. (MMI) & Machining Investments, LLC (MI) together Profitability: EBITDA MMI 2005 EBITDA MM 2005 Total EBITDA 2005both companies Debt Service Requirements: MMI - New Loans Term Loan (monthly payment of P&I) 12 = Annual Pymt Line of Credit (at max.loan amt. outstanding S 8.75% = Annual Pymt $ [Prime Rate was 7.75 in April '06. Interest is P+1.00%) Total Debt Service for MMI MI - New Loans Mortgage Loan (monthly payment of P&D) S = Annual Pymt $ Total Debt Service for MI $ x 12 Total Debt Service - both companies Does both companies total profitability cover debt service? Yes No