Answered step by step
Verified Expert Solution
Question
1 Approved Answer
Franks business plan in the Appendix (Chapter 16 Appendix: A Sample Business Plan) provides projected income statements and balance sheets for a five-year forecast horizon.
Franks business plan in the Appendix (Chapter 16 "Appendix: A Sample Business Plan") provides projected income statements and balance sheets for a five-year forecast horizon. Compute the same ratios as in Exercise 8 and comment on your results.
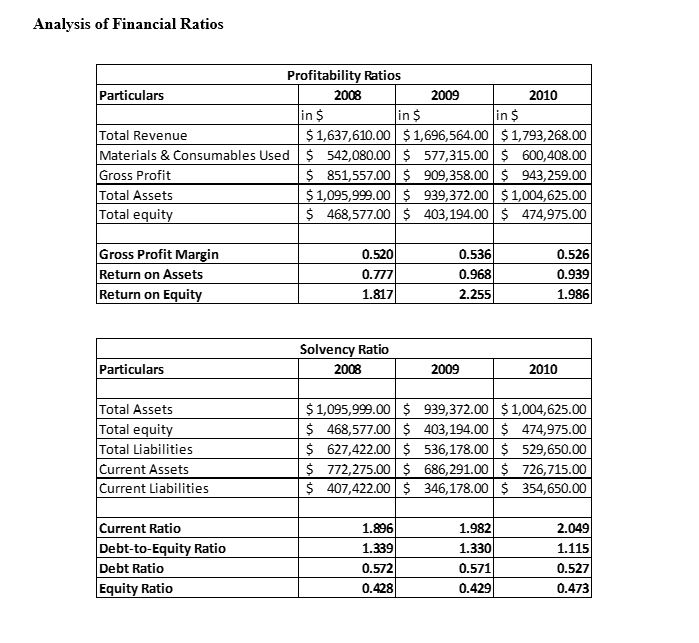
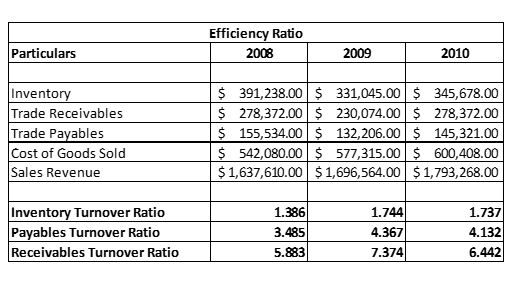
Below is the same ratios as the exercise 8


the business plan can be found below pdf book last chapter 16
https://www.saylor.org/site/textbooks/Small%20Business%20Management%20in%20the%2021st%20Century.pdf
Analysis of Financial Ratios Profitability Ratios 2008 Particulars 2009 2010 in in in $1,637,610.00 $1,696,564.00 $1,793,268.00 Total Revenue Materials & Consumables Used 542,080.00 $ 577,315.00$ 600,408.00 Gross Profit Total Assets Total equit 5 851,557.00 S 909.358.00 943,259.00 1,095.999.00 939,372.00 $1,004,625.00 468,577.00 403,194.00 474,975.00 0.520 Gross Profit Margir Return on Assets Return on Equit 0.536 0.968 2.255 0.526 0.939 1.986 1.817 Solvency Ratio 2008 Particulars 2009 2010 Total Assets Total equit Total Liabilities Current Assets Current Liabilities $1,095,999.00$ 939,372.00 $1,004,625.00 468,577.00403,194.00 474,975.00 627,422.00 536,178.00 529,650.00 5 772,275.00 S 686,291.00 726,715.00 407,422.00 346,178.00 354,650.00 Current Ratio Debt-to-Equity Ratio Debt Ratio Equity Ratio 1.896 1.339 0.572 0.428 1.982 1.330 0.571 0.429 2.049 1.115 0.527 0.473 Analysis of Financial Ratios Profitability Ratios 2008 Particulars 2009 2010 in in in $1,637,610.00 $1,696,564.00 $1,793,268.00 Total Revenue Materials & Consumables Used 542,080.00 $ 577,315.00$ 600,408.00 Gross Profit Total Assets Total equit 5 851,557.00 S 909.358.00 943,259.00 1,095.999.00 939,372.00 $1,004,625.00 468,577.00 403,194.00 474,975.00 0.520 Gross Profit Margir Return on Assets Return on Equit 0.536 0.968 2.255 0.526 0.939 1.986 1.817 Solvency Ratio 2008 Particulars 2009 2010 Total Assets Total equit Total Liabilities Current Assets Current Liabilities $1,095,999.00$ 939,372.00 $1,004,625.00 468,577.00403,194.00 474,975.00 627,422.00 536,178.00 529,650.00 5 772,275.00 S 686,291.00 726,715.00 407,422.00 346,178.00 354,650.00 Current Ratio Debt-to-Equity Ratio Debt Ratio Equity Ratio 1.896 1.339 0.572 0.428 1.982 1.330 0.571 0.429 2.049 1.115 0.527 0.473
Step by Step Solution
There are 3 Steps involved in it
Step: 1

Get Instant Access to Expert-Tailored Solutions
See step-by-step solutions with expert insights and AI powered tools for academic success
Step: 2

Step: 3

Ace Your Homework with AI
Get the answers you need in no time with our AI-driven, step-by-step assistance
Get Started


