Freedom Fireworks (4b)
Using the General Ledger, complete the appropriate multi-step income statement and balance sheet. After, complete the analysis.
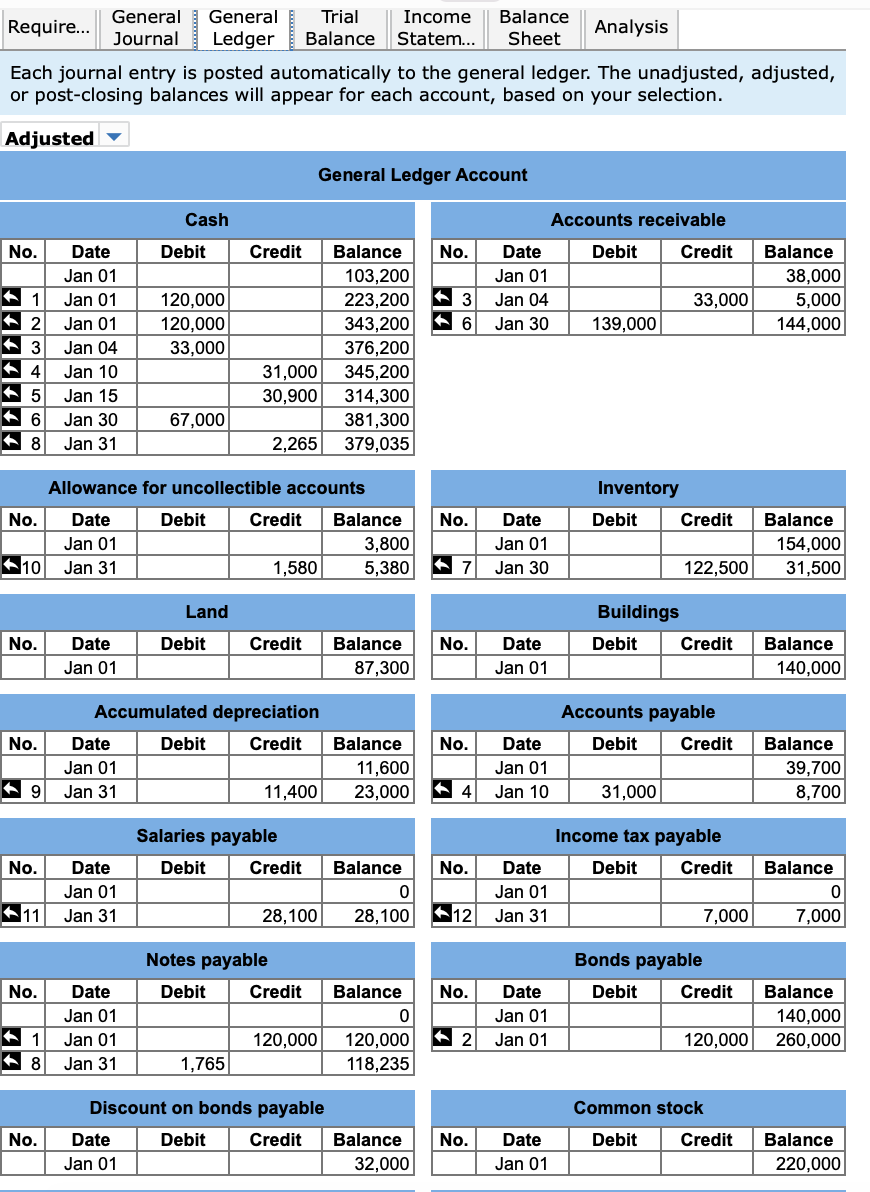
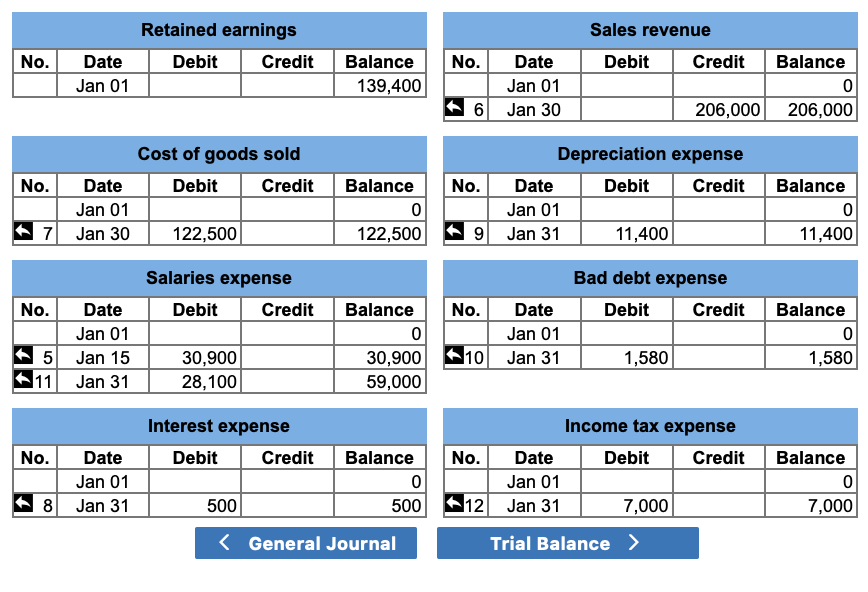
(adjusted balances given below)
(post-closing balances given below)
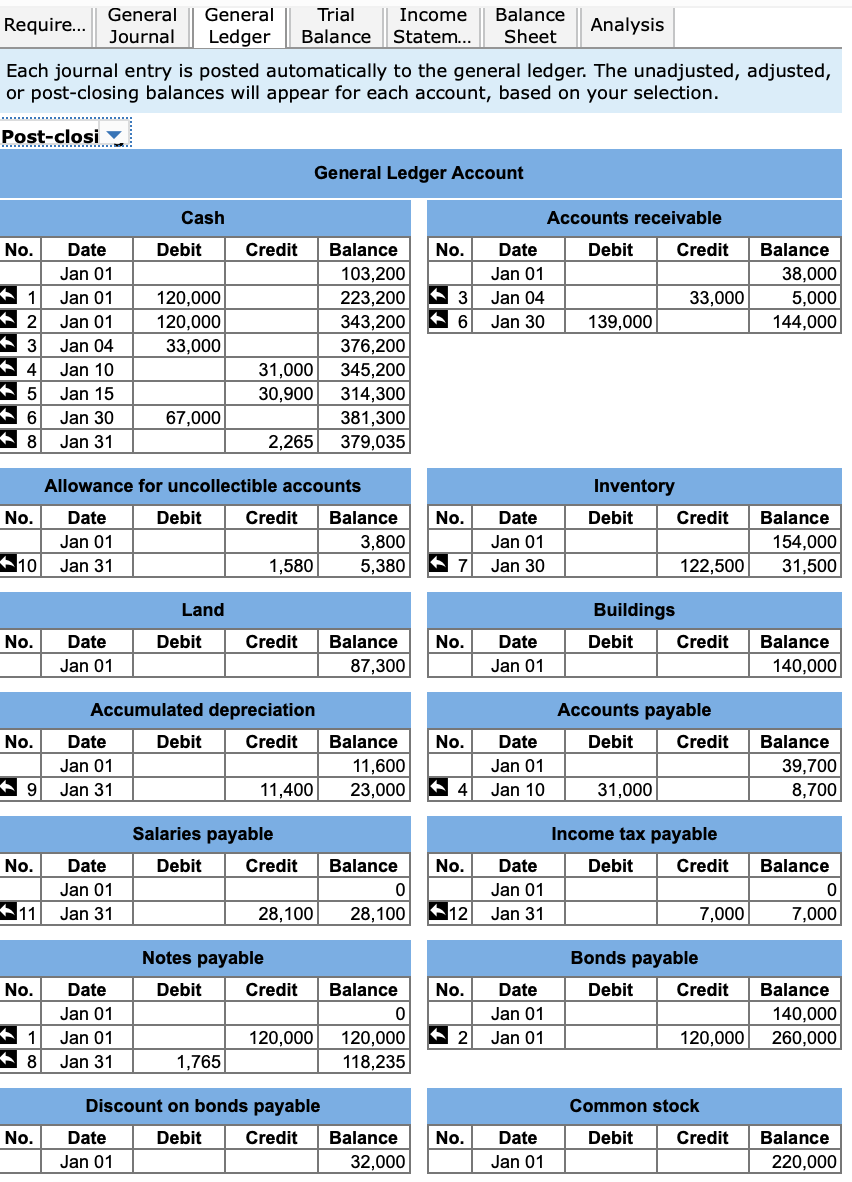
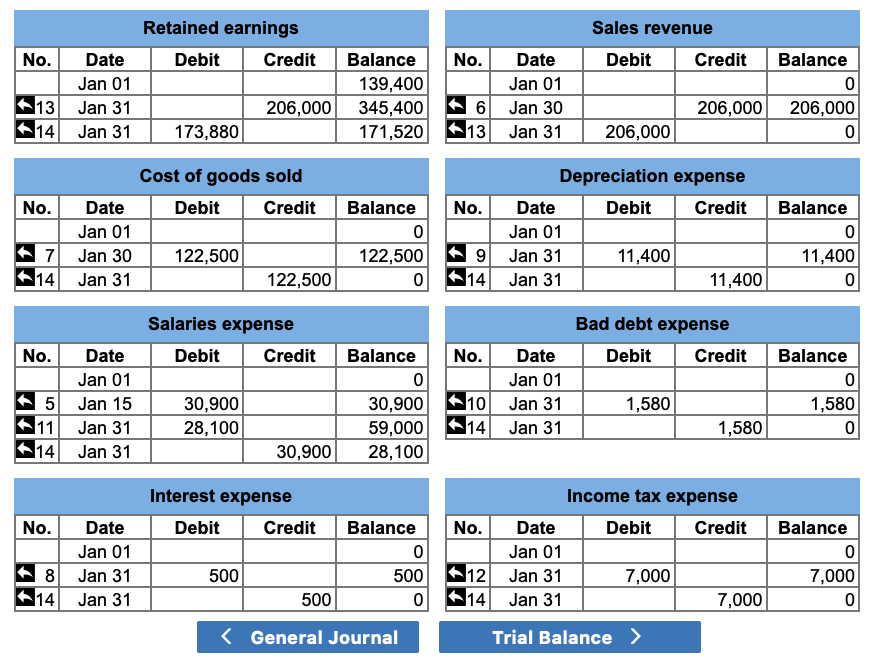
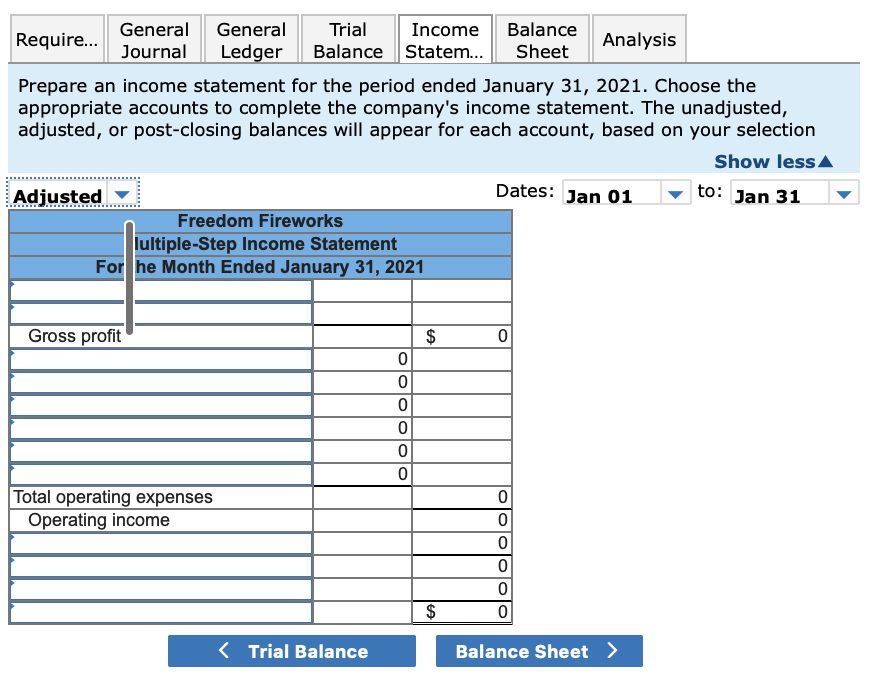
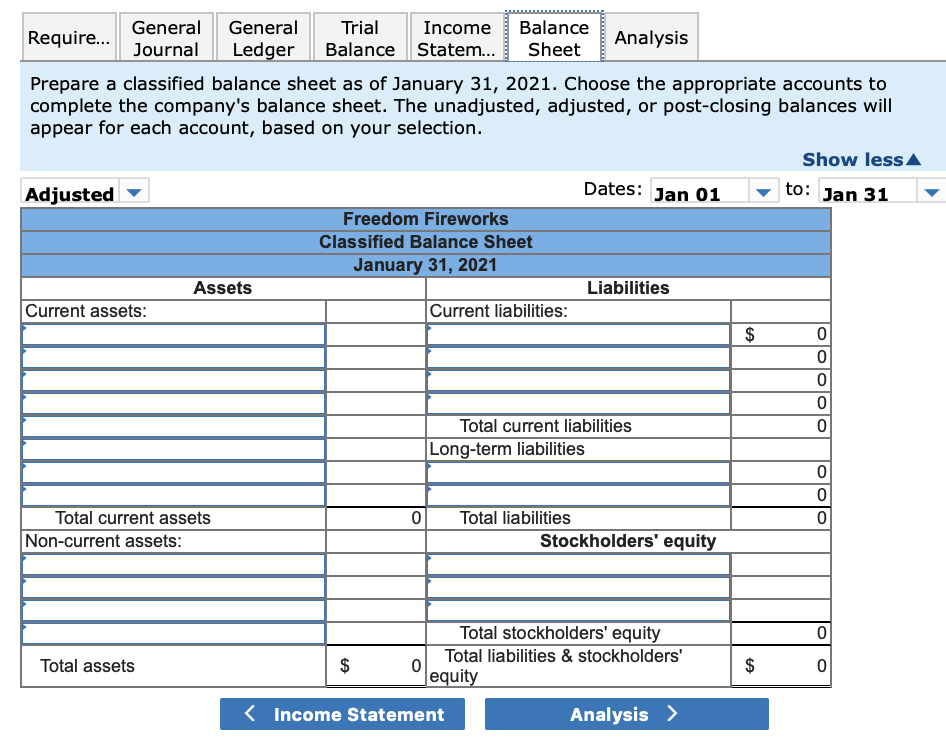
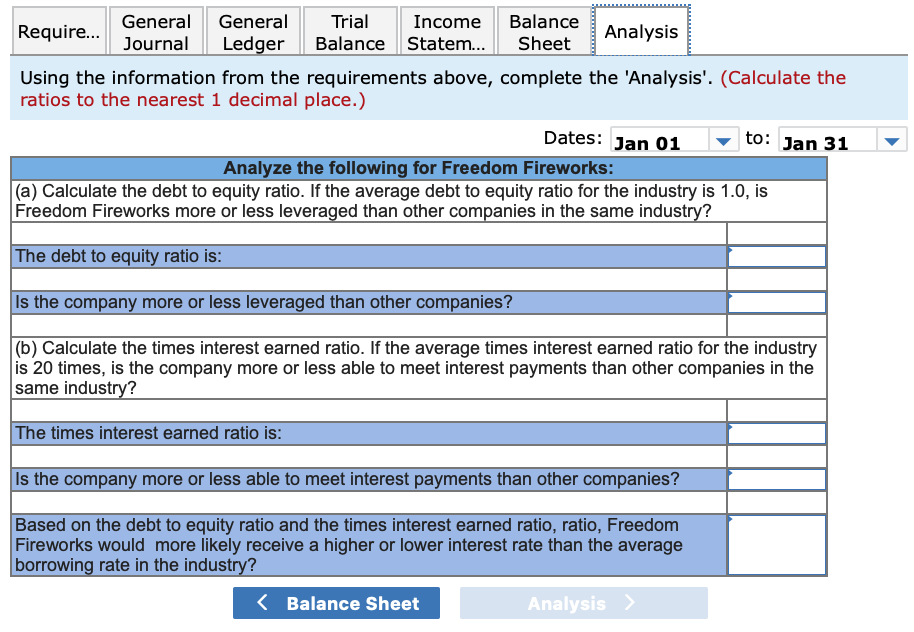
| General General Trial Income Balance Require... Analysis Journal Ledger Balance Statem... | Sheet Each journal entry is posted automatically to the general ledger. The unadjusted, adjusted, or post-closing balances will appear for each account, based on your selection. Adjusted General Ledger Account Cash Debit No. Credit No. Accounts receivable Date Debit Credit Jan 01 Jan 04 33,000 Jan 30 139,000 Balance 38,000 5,000 144,000 120.000 120.000 33,000 3 6 Date Jan 01 Jan 01 | Jan 01 | Jan 04 Jan 10 Jan 15 Jan 30 Jan 31 1 2 3 4 5 6 8 Balance 103,200 223,200 343,200 376,200 345,200 314.300 381,300 379,035 31,000 30.900 67.000 2,265 Allowance for uncollectible accounts No. Date Debit Credit Balance Jan 01 3,800 10 Jan 31 1,580 5,380 Inventory Debit Credit No. Date Jan 01 Jan 30 Balance 154,000 31,500 7 122,500 Land Debit Buildings Debit Credit No. Credit No. Date Jan 01 Balance 87,300 Date Jan 01 Balance 140,000 Accumulated depreciation Date Debit Credit Jan 01 Jan 31 11,400 Accounts payable Debit Credit No. No. Balance 11,600 23,000 Date Jan 01 Jan 10 Balance 39,700 8,700 9 4 31,000 Salaries payable Debit Credit No. Balance No. Date Jan 01 Jan 31 Income tax payable Date Debit Credit Jan 01 Jan 31 7,000 Balance 11 28,100 28,100 12 7,000 Notes payable Debit Credit Bonds payable Debit Credit No. Balance Date Jan 01 Jan 01 Jan 31 Date Jan 01 Jan 01 Balance 140,000 260,000 120,000 2 120,000 1 8 120,000 118,235 1,765 Discount on bonds payable Date Debit Credit Balance Jan 01 32,000 Common stock | Debit Credit No. No. Date Jan 01 Balance 220,000 No. Retained earnings Date Debit Credit Jan 01 Sales revenue Debit | Credit No. Balance Balance 139,400 Date Jan 01 Jan 30 6 206,000 206,000 No. Balance No. Cost of goods sold Date Debit Credit Jan 01 Jan 30 122,500 Depreciation expense Date Debit | Credit Jan 01 Jan 31 11,400 Balance 7 122,500 9 11,400 Salaries expense | Credit Bad debt expense Debit Credit No. Balance No. Balance Date Jan 01 Jan 15 Jan 31 Date Jan 01 Jan 31 10 1,580 1,580 5 11 30,900 28,100 30,900 59,000 Interest expense Debit Credit No. Balance No. Income tax expense Date Debit Credit Jan 01 Jan 317 ,000 Date Jan 01 Jan 31 Balance 0 8 500 500 12 7,000 | General | General Trial Income Balance Analysis Require... Journal Ledger Balance Statem... | Sheet Each journal entry is posted automatically to the general ledger. The unadjusted, adjusted, or post-closing balances will appear for each account, based on your selection. Post-closi General Ledger Account Cash Debit No. Credit No. Accounts receivable Date Debit Credit Jan 01 Jan 04 33,000 Jan 30 | 139,000 Balance 38,000 5,000 144,000 120,000 120,000 33,000 3 6 * Date Jan 01 Jan 01 Jan 01 Jan 04 Jan 10 Jan 15 Jan 30 Jan 31 1 2 3 4 5 6 8 Balance 103,200 223,200 343,200 376,200 345,200 314,300 381,300 379,035 * 31,000 30,900 67,000 2,265 Alloy Allowance for uncollectible accounts No. Date Debit Credit Balance Jan 01 3,800 *10 Jan 31 1,580 5.380 Inventory | Debit Credit No. Date Jan 01 Jan 30 Balance 154,000 31,500 7 | 122,500 Land Buildings Debit Credit No. Debit Credit No. Date Jan 01 Balance 87,300 Date Jan 01 Balance 140,000 No. Accumulated depreciation Date Debit Credit Jan 01 Jan 31 11,400 No. Balance 11,600 23,000 Accounts payable Date Debit | Credit Jan 01 Jan 10 | 31,000 Balance 39,700 8,700 * 9 4 Income tax payable Salaries payable Debit Credit No. Balance No. Debit Credit Balance Date Jan 01 Jan 31 Date Jan 01 Jan 31 11 28,100 28,100 12 7,000 7,000 Notes payable Debit Credit Bonds payable Debit Credit No. Balance No. ol Date Jan 01 Jan 01 Jan 31 Date Jan 01 Jan 01 Balance 140,000 260,000 120,000 2 120,000 + * 1 8 120,000 118,235 1,765 Discount on bonds payable Date Debit Credit Balance Jan 01 32,000 Common stock Debit Credit No. No. Date Jan 01 Balance | 220,000 Sales revenue Debit Credit No. No. Balance Retained earnings Date Debit Credit Jan 01 Jan 31 206,000 Jan 31 173,880 Balance 139,400 345,400 171,520 Date Jan 01 Jan 30 Jan 31 206,000 206,000 13 14 6 13 206,000 No. Balance No. Balance Cost of goods sold Date Debit Credit Jan 01 Jan 30 122,500 Jan 31 122,500 Depreciation expense Date | Debit Credit Jan 01 Jan 31 11,400 Jan 31 11,400 122,500 11,400 7 14 9 14 Salaries expense Debit Credit Bad debt expense Debit Credit No. Balance No. Balance Date Jan 01 Jan 15 Jan 31 Jan 31 5 11 14 Date Jan 01 Jan 31 Jan 31 30.900 28.100 10 14 1,580 30,900 59,000 28,100 1,580 1,580 0 1 30,900 Interest expense Debit Credit No. Balance No. Balance Date Jan 01 Jan 31 Jan 31 Income tax expense Date Debit Credit Jan 01 Jan 31 7,000 Jan 31 7,000 500 500 7,000 8 14 12 14 500 General General Require... Trial Income Balance Journal Ledger Balance Statem... Sheet Analysis Prepare a classified balance sheet as of January 31, 2021. Choose the appropriate accounts to complete the company's balance sheet. The unadjusted, adjusted, or post-closing balances will appear for each account, based on your selection. Show less Adjusted - Dates: Jan 01 to: Jan 31 Freedom Fireworks Classified Balance Sheet January 31, 2021 Assets Liabilities Current assets: Current liabilities: Total current liabilities Long-term liabilities III OOOOO 0 Total current assets Non-current assets: Total liabilities Stockholders' equity 0 LO Total stockholders' equity Total liabilities & stockholders' equity Total assets General General Require... | Journal | Ledger Trial Balance Income Statem... | Balance Sheet Analysis Using the information from the requirements above, complete the 'Analysis'. (Calculate the ratios to the nearest 1 decimal place.) Dates: Jan 01 to: Jan 31 Analyze the following for Freedom Fireworks: (a) Calculate the debt to equity ratio. If the average debt to equity ratio for the industry is 1.0, is Freedom Fireworks more or less leveraged than other companies in the same industry? The debt to equity ratio is: Is the company more or less leveraged than other companies? (b) Calculate the times interest earned ratio. If the average times interest earned ratio for the industry is 20 times, is the company more or less able to meet interest payments than other companies in the same industry? The times interest earned ratio is: Is the company more or less able to meet interest payments than other companies? Based on the debt to equity ratio and the times interest earned ratio, ratio, Freedom Fireworks would more likely receive a higher or lower interest rate than the average borrowing rate in the industry?


