Question
Frenchies: Creating and Using a Master Budget Sales Department _ 1 of 3 PART 1: CREATING THE BUDGET MEETING WITH DIVISIONAL MANAGERS Last quarter, ended
Frenchies: Creating and Using a Master Budget Sales Department _ 1 of 3
PART 1: CREATING THE BUDGET MEETING WITH DIVISIONAL MANAGERS
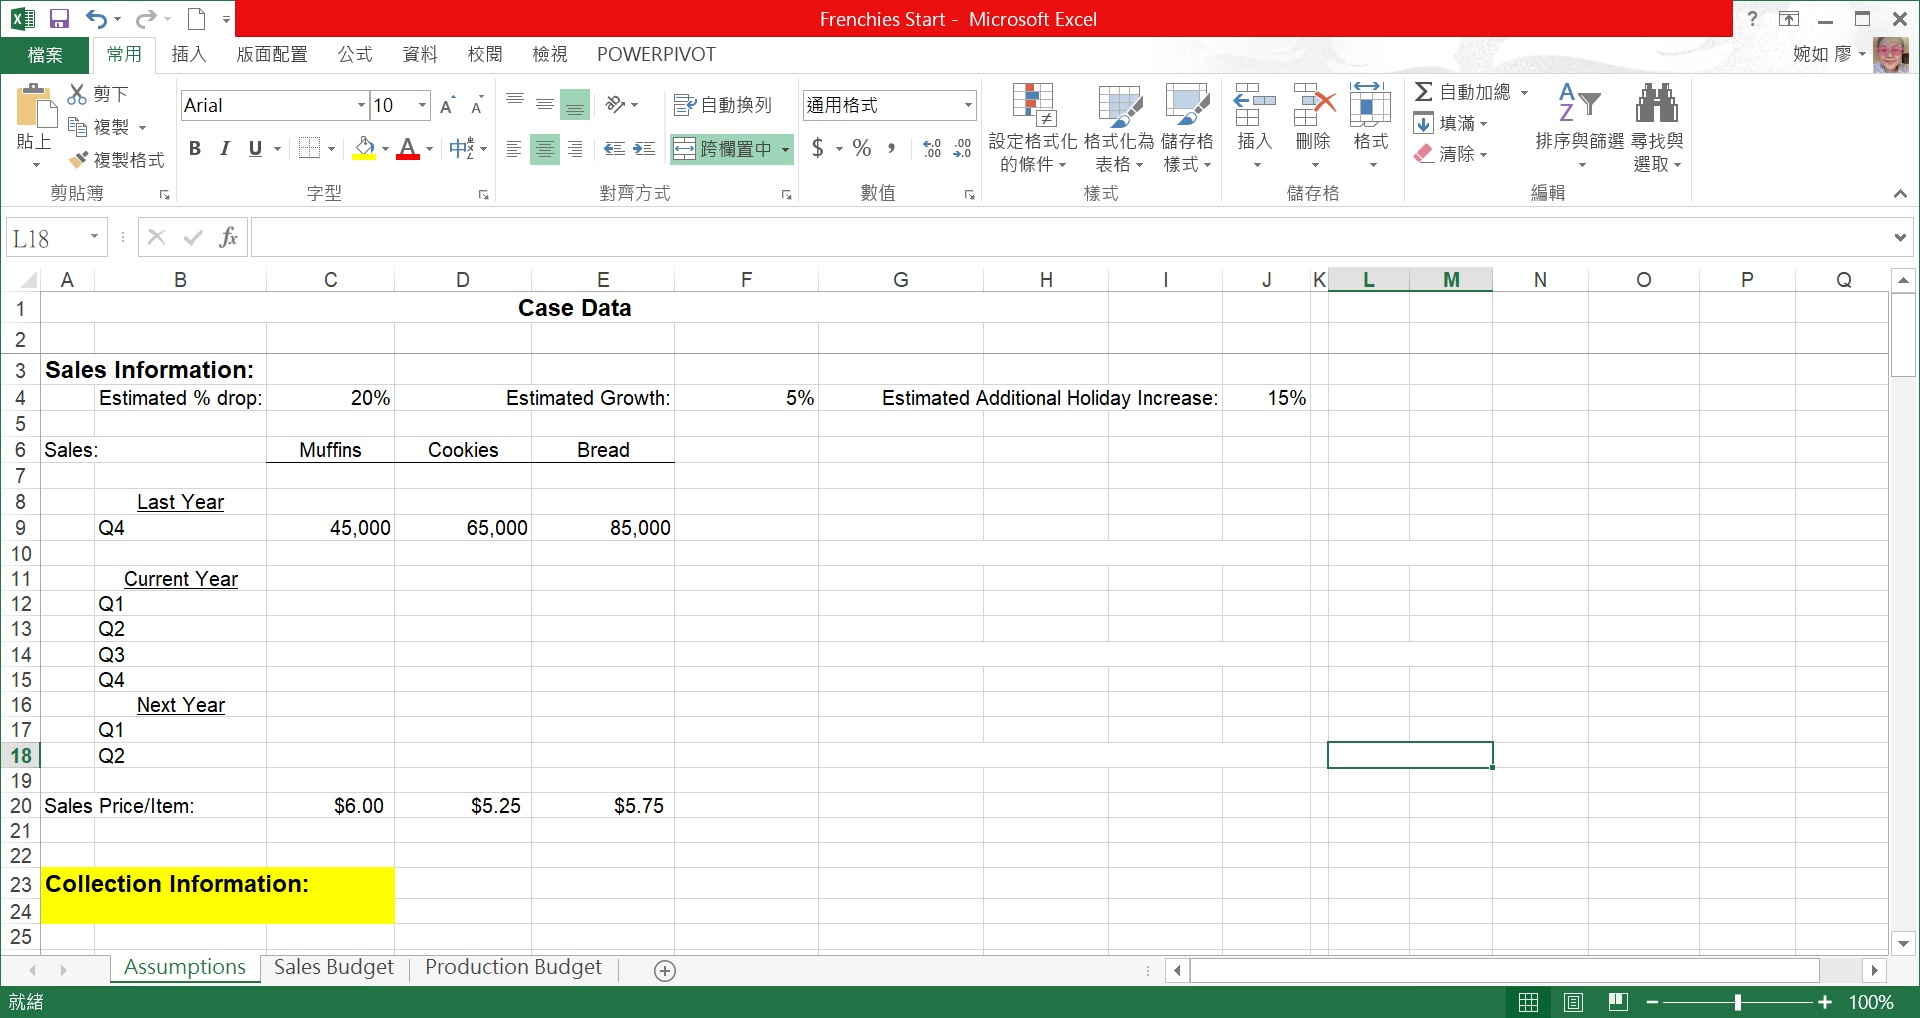
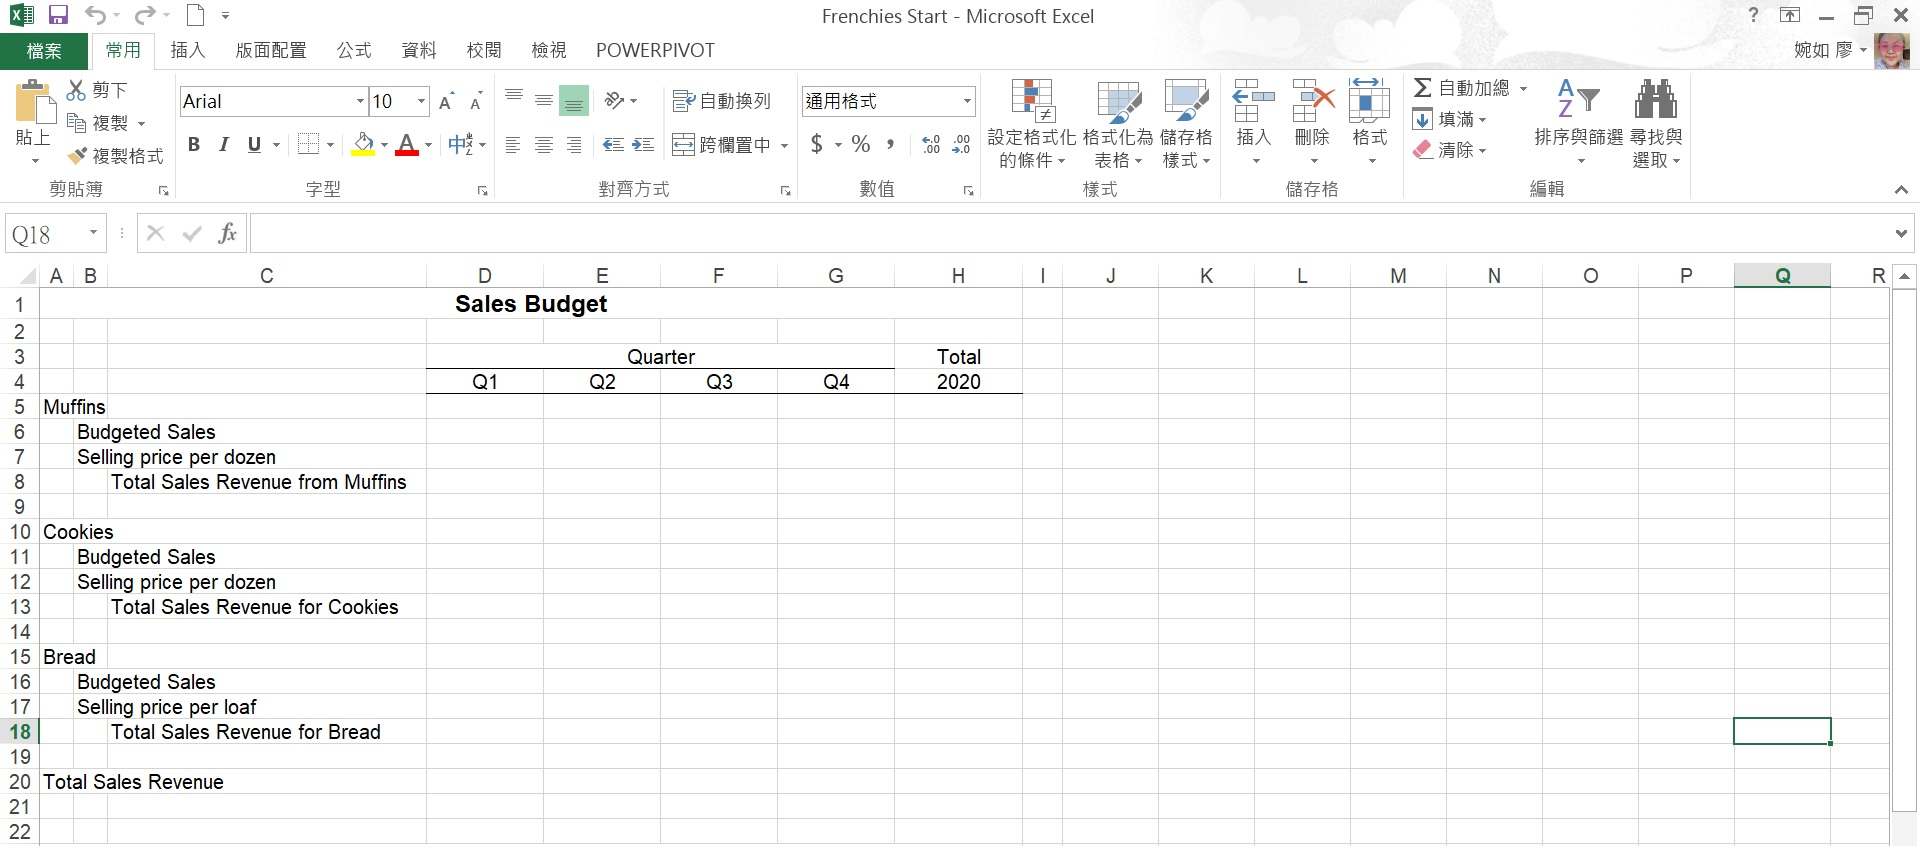
Last quarter, ended on December 31, 2018. Frenchies sold 45,000 one-dozen packages of muffins for $5.50 each, 65,000 one-dozen packages of cookies for $4.75 each, and 85,000 one-dozen loaves of bread for $5.25 each. The sales Department is considering to raise the prices slightly next year without a sharp drop in sales. He was thinking $6.00 for muffins, $5.25 for cookies, and $5.75 for bread. After holidays, the sales situations always drop off a bit, but with the increase in sales price. The sales manager would say a 20 percent drop from the fourth quarter results. A 10 percent drop is normal after Christmas, but couple that with the increased prices, and 20 percent is reasonable. After that, sales will grow steadily at about 5 percent a quarter with these new prices. Fourth-quarter sales will be high because of the holidays lets say 20 percent, instead of 5 percent, from the third to the fourth quarter. The first quarter of the following year will continue the 5 percent growth as though the holiday jump didnt occur. The company collects 30 percent of the credit sales within the current quarter, 45 percent in the following quarter, and 25 percent in the quarter after that. There is no bad debt. What were total sales during the third and fourth quarters of last year, and are we still collecting any of that money? Total sales were $802,000 and $1,002,500, respectively, and we are still collecting.


PART 2: USING THE MASTER BUDGET MEETING OF THE SENIOR STAFF (TWO WEEKS LATER)
We could increase our sales commissions to 2 percent. That should motivate our sales force to sell more. Id say that would increase our sales growth from 5 to 8 percent each quarter. For my part, the chef jumped in, we could switch to a JIT inventory system, keeping only about 3 percent of our needed raw materials on hand. That would cut down on some of our costs, but it would also require us to pay for our entire inventory in the quarter it is purchased rather than paying 15 percent in the following quarter like we do now. If we were to add an additional collections specialist to our office staff, we could improve our collections to be 80 percent in the first quarter, 15 percent in the second quarter, and 5 percent in the third quarter. That would certainly improve our cash flows. Given the job market right now, I think we could hire a good collections specialist for $30,000 a year. They might help collections, but those kinds of tactics could hurt our sales. Our relaxed collections policy is one of the things that set us apart from other vendors. If you decide to try that, youd better plan on an additional 3 percent drop in sales the first quarter. If we changed our current 20 percent estimate to a more realistic drop, it would take care of everything! Based on the research Ive been doing in the industry; we could use 10 percent instead of 20. Think about it. Our EPS would be higher and so would our cash flow from operations. Why, even our profit margin would increase because our fixed costs would be allocated over more units. Another option, lets say we only increased our prices to $5.75 for muffins, $5.00 for cookies, and $5.50 for bread. By my calculations, that would lead to only a 12 percent drop in sales in quarter one with 7 percent growth in each of the following quarters. Why dont you run the numbers, including how these changes would affect our use of the line of credit, to see which of the changes will give us the most bang. Well go ahead and make that change now and add the others to our improvement plan. That way, we can go to them with a current improvement and a plan to keep improving. And if anyone gets any other ideas, let us know. The more improvements we take to the table, the better our chances of signing the deal.
Frenchies Start - Microsoft Excel ? POWERPIVOT Arial 10 | A A AY ||| * , W, BIU $,%, 00 .00 0 , ,, , L18 X fx A B C D F G H J K L M N 0 P 0 | E Case Data - Estimated Growth: 5% Estimated Additional Holiday Increase: 15% Cookies Bread 65,000 85,000 2 3 Sales Information: 4 Estimated % drop: 20% 5 66 Sales: Muffins 7 8 Last Year 9 Q4 45,000 10 11 Current Year 12 Q1 13 Q2 14 Q3 5 Q4 16 Next Year 17 Q1 18 Q2 19 20 Sales Price/Item: $6.00 21 22 23 Collection Information: 24 25 Assumptions Sales Budget $5.25 $5.75 Production Budget (+) ||| - + 100% Frenchies Start - Microsoft Excel ? - POWERPIVOT , Arial - 10 -A A , , 27 BIU, , $ %, 100 9 .00 , , , g Q18 X fic A B C F G H | J K L M N 0 P 0 RA D E Sales Budget 1 Quarter Total 2020 Q1 Q2 Q3 Q4 2 3 4 5 Muffins 6 Budgeted Sales 7 Selling price per dozen 8 Total Sales Revenue from Muffins 9 10 Cookies 11 Budgeted Sales 12 Selling price per dozen 13 Total Sales Revenue for Cookies 14 15 Bread 16 Budgeted Sales 17 Selling price per loaf 18 Total Sales Revenue for Bread 19 20 Total Sales Revenue 21 22Step by Step Solution
There are 3 Steps involved in it
Step: 1

Get Instant Access to Expert-Tailored Solutions
See step-by-step solutions with expert insights and AI powered tools for academic success
Step: 2

Step: 3

Ace Your Homework with AI
Get the answers you need in no time with our AI-driven, step-by-step assistance
Get Started


