Question
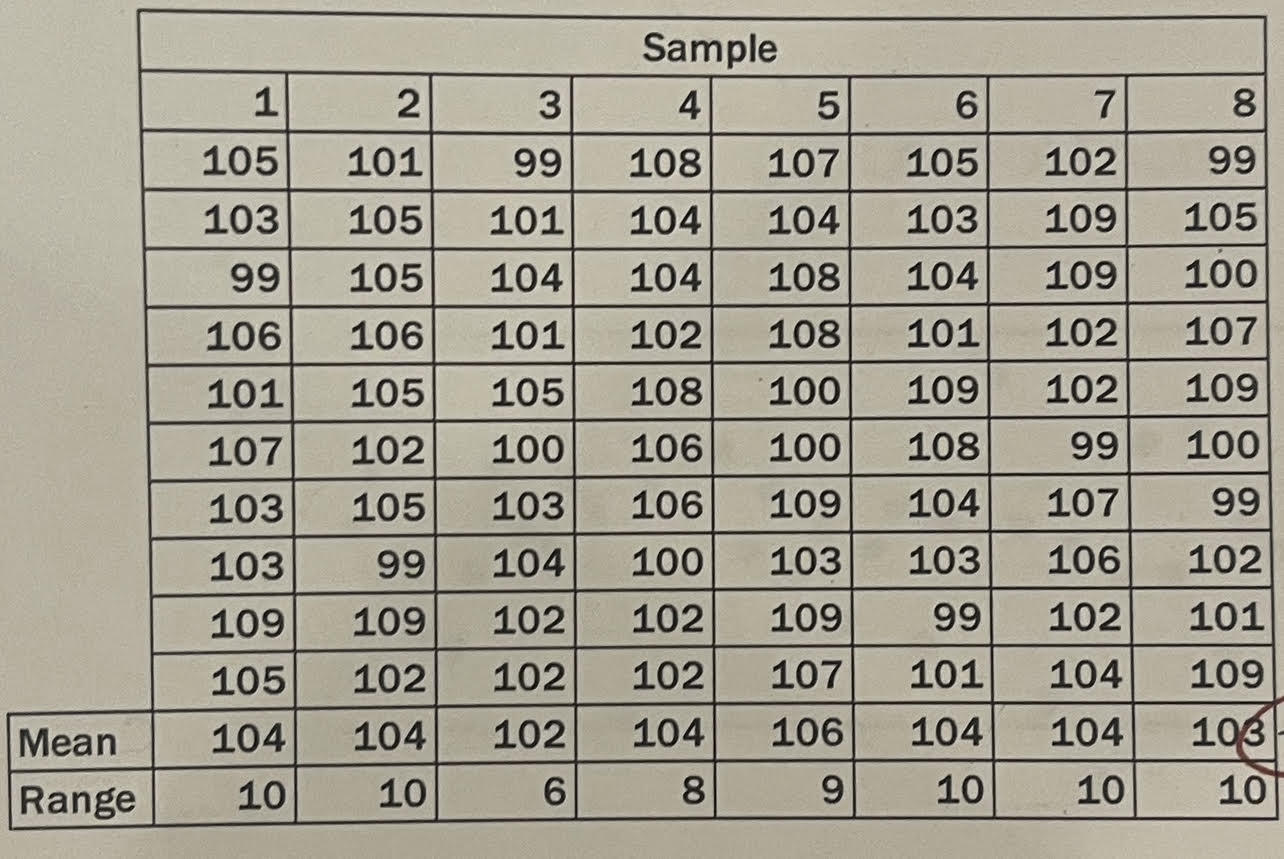
Fresh Food Farms has taken 8 samples of ten observations each of the weight of 100g pack of olives, the results are displayed below. a)
Fresh Food Farms has taken 8 samples of ten observations each of the weight of 100g pack of olives, the results are displayed below.

a) Using the table above, determine the upper and lower control limits for sample mean and range. Place your final answers, rounded to two decimals, in the appropriate boxes in the table below.
| UCL | LCL | |
| Mean Control Limits | ? | ? |
| Range Control Limits | ? | ? |
b) Is the process in control? Yes or No
c) In the newest sample of olive packs, the results are 102, 101, 105, 105, 103, 107, 101, 103, 107, and 104. Compute the summary statistics for this new sample. Use the control limits determined in part (a) to decide if the process is still in control. Find the following..
Mean of sample: ?
Range of Sample: ?
Is this process still in control: Yes or No
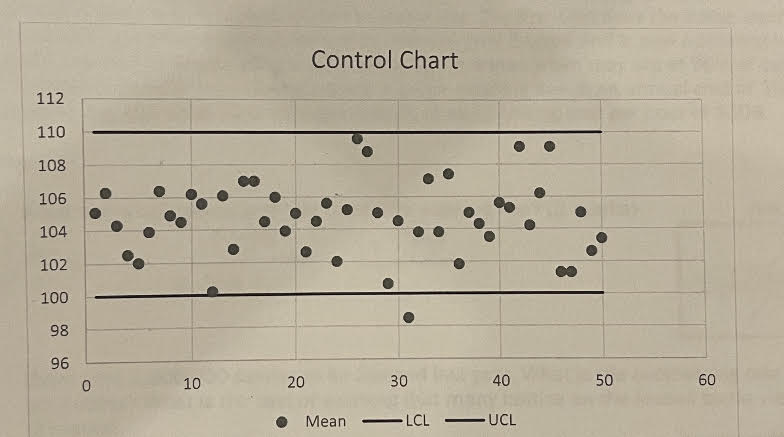
d) Below is a X-bar control chart for 50 samples of the weight of 100g vacuum packs of cheese from Fresh Food Farms

e) Fresh Food Farms uses a sample size of 50 when performing quality control checks to assure that the weight of the pasta is at least 500g. Over the past 20 samples a total of 30 packages have been underfilled. Provide the parameters for P chart as shown below
p-bar:
p:
UCL:
LCL:
m+n1Lu+
Step by Step Solution
There are 3 Steps involved in it
Step: 1

Get Instant Access to Expert-Tailored Solutions
See step-by-step solutions with expert insights and AI powered tools for academic success
Step: 2

Step: 3

Ace Your Homework with AI
Get the answers you need in no time with our AI-driven, step-by-step assistance
Get Started


