

Answered step by step
Verified Expert Solution
Question
1 Approved Answer
From 2017 to 2021 pleaseee! few ratios are okay please helpp help please this is my second time to submit it Annual Data 1 Millions
From 2017 to 2021 pleaseee!
few ratios are okay 
please helpp 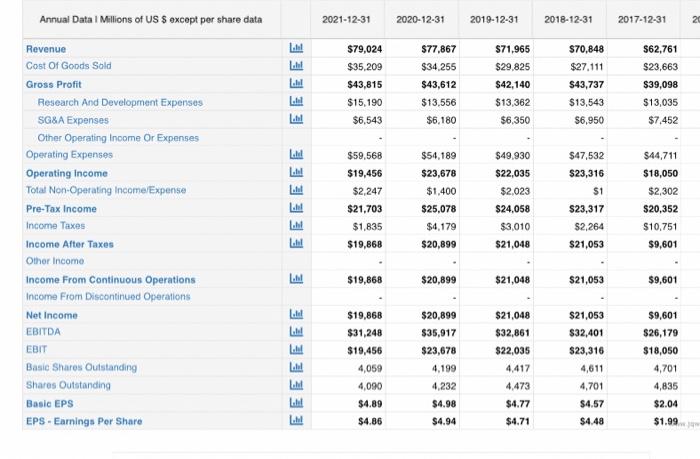
help please this is my second time to submit it
Annual Data 1 Millions of US $ except per share data 2021-12-31 2020-12-31 2019-12-31 2018-12-31 2017-12-31 20 EEEEE $79,024 $35,209 $43,815 $15,190 $6,543 $77,867 $34.255 $43,612 $13,556 $6,180 $71,965 $29.825 $42,140 $13,362 $6,350 $70,848 $27.111 $43,737 $13,543 $6,950 $62,761 $23,663 $39,098 $13,035 $7.452 $49.930 $47,532 $23,316 $1 Revenue Cost of Goods Sold Gross Profit Research And Development Expenses SG&A Expenses Other Operating Income Or Expenses Operating Expenses Operating Income Total Non-Operating Income/Expense Pre-Tax Income Income Taxes Income After Taxes Other Income Income From Continuous Operations Income From Discontinued Operations Net Income EBITDA EDIT Basic Shares Outstanding Shares Outstanding Basic EPS EPS - Earnings Per Share EEEEEE $59,568 $19,456 $2,247 $21,703 $1,835 $19,868 $54,189 $23,678 $1,400 $25,078 $4,179 $20,899 $22,035 $2.023 $24,058 $3,010 $21,048 $44,711 $18,050 $2,302 $20,352 $10,751 $9,601 $23,317 $2,264 $21,053 E IM $19,868 $20,899 $21,048 $21,053 $9,601 EEEEEEE $19,868 $31,248 $19,456 4,059 4,090 $4.89 $4.86 $20,899 $35,917 $23,678 4,199 4,232 $4.98 $21,048 $32,861 $22,035 4.417 4,473 $4.77 $4.71 $21,053 $32,401 $23,316 4,611 4,701 $4.57 $4.48 $9,601 $26,179 $18,050 4,701 4,835 $2.04 $4.94 $1.99 Part (2): Accounting and Financial Analysis Reformulate Financial Statements Apply financial ratios and relationships with commentaries. Make a recommendation regrading which company has a better financial profile. Annual Data 1 Millions of US $ except per share data 2021-12-31 2020-12-31 2019-12-31 2018-12-31 2017-12-31 20 EEEEE $79,024 $35,209 $43,815 $15,190 $6,543 $77,867 $34.255 $43,612 $13,556 $6,180 $71,965 $29.825 $42,140 $13,362 $6,350 $70,848 $27.111 $43,737 $13,543 $6,950 $62,761 $23,663 $39,098 $13,035 $7.452 $49.930 $47,532 $23,316 $1 Revenue Cost of Goods Sold Gross Profit Research And Development Expenses SG&A Expenses Other Operating Income Or Expenses Operating Expenses Operating Income Total Non-Operating Income/Expense Pre-Tax Income Income Taxes Income After Taxes Other Income Income From Continuous Operations Income From Discontinued Operations Net Income EBITDA EDIT Basic Shares Outstanding Shares Outstanding Basic EPS EPS - Earnings Per Share EEEEEE $59,568 $19,456 $2,247 $21,703 $1,835 $19,868 $54,189 $23,678 $1,400 $25,078 $4,179 $20,899 $22,035 $2.023 $24,058 $3,010 $21,048 $44,711 $18,050 $2,302 $20,352 $10,751 $9,601 $23,317 $2,264 $21,053 E IM $19,868 $20,899 $21,048 $21,053 $9,601 EEEEEEE $19,868 $31,248 $19,456 4,059 4,090 $4.89 $4.86 $20,899 $35,917 $23,678 4,199 4,232 $4.98 $21,048 $32,861 $22,035 4.417 4,473 $4.77 $4.71 $21,053 $32,401 $23,316 4,611 4,701 $4.57 $4.48 $9,601 $26,179 $18,050 4,701 4,835 $2.04 $4.94 $1.99 Part (2): Accounting and Financial Analysis Reformulate Financial Statements Apply financial ratios and relationships with commentaries. Make a recommendation regrading which company has a better financial profile Step by Step Solution
There are 3 Steps involved in it
Step: 1

Get Instant Access to Expert-Tailored Solutions
See step-by-step solutions with expert insights and AI powered tools for academic success
Step: 2

Step: 3
Ace Your Homework with AI
Get the answers you need in no time with our AI-driven, step-by-step assistance
Get Started
The Essentials Of Machine Learning In Finance And Accounting
Authors: Mohammad Zoynul Abedin, M. Kabir Hassan, Petr Hajek, Mohammed Mohi Uddin
1st Edition
0367480816, 978-0367480813