

Answered step by step
Verified Expert Solution
Question
1 Approved Answer
From computing with Matlab 5.12: Please provide brief comments. Please remember this is considered a basic matlab problem and extremely advanced coding will not be
From computing with Matlab 5.12:
Please provide brief comments. Please remember this is considered a basic matlab problem and extremely advanced coding will not be understood.
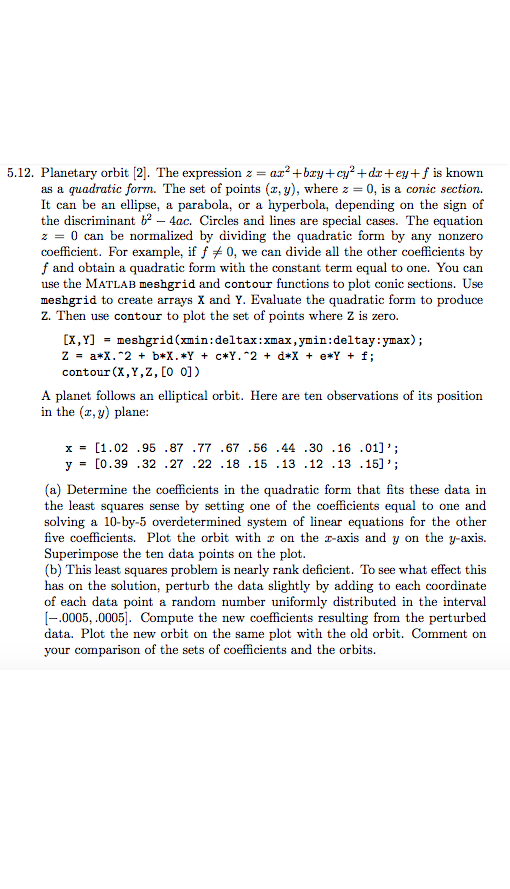
5.12. Planetary orbit [2] . The expression z = az4bzy+cy2-dz+ey+f is known as a quadratic form. The set of points (z, y), where z 0, is a conic section. It can be an ellipse, a parabola, or a hyperbola, depending on the sign of the discriminantb-4ac. Circles and lines are special cases. The equation z0 can be normalized by dividing the quadratic form by any nonzero coefficient. For example, if f 0, we can divide all the other coefficients by f and obtain a quadratic form with the constant term equal to one. You can use the MATLAB meshgrid and contour functions to plot conic sections. Use meshgrid to create arrays X and Y. Evaluate the quadratic form to produce Z. Then use contour to plot the set of points where Z is zero. (X,Y] meshgrid (xmin: deltax: xmax,ymin: deltay: ymax); = contour (X,Y,Z, [O 0]) A planet follows an elliptical orbit. Here are ten observations of its position in the (x, y) plane: x=[1.02 .95 .87 .77 .67 .56 .44 .30 .16 .01]'; y = [0.39 .32 .27 .22 .18 .15 .13 .12 .13 .15],; (a) Determine the coefficients in the quadratic form that fits these data in the least squares sense by setting one of the coefficients equal to one and solving a 10-by-5 overdetermined system of linear equations for the other five coefficients. Plot the orbit with x on the r-axis and y on the y-axis. Superimpose the ten data points on the plot (b) This least squares problem is nearly rank deficient. To see what effect this has on the solution, perturb the data slightly by adding to each coordinate of each data point a random number uniformly distributed in the interval -.0005,.0005]. Compute the new coefficients resulting from the perturbed data. Plot the new orbit on the same plot with the old orbit. Comment on your comparison of the sets of coefficients and the orbits. 5.12. Planetary orbit [2] . The expression z = az4bzy+cy2-dz+ey+f is known as a quadratic form. The set of points (z, y), where z 0, is a conic section. It can be an ellipse, a parabola, or a hyperbola, depending on the sign of the discriminantb-4ac. Circles and lines are special cases. The equation z0 can be normalized by dividing the quadratic form by any nonzero coefficient. For example, if f 0, we can divide all the other coefficients by f and obtain a quadratic form with the constant term equal to one. You can use the MATLAB meshgrid and contour functions to plot conic sections. Use meshgrid to create arrays X and Y. Evaluate the quadratic form to produce Z. Then use contour to plot the set of points where Z is zero. (X,Y] meshgrid (xmin: deltax: xmax,ymin: deltay: ymax); = contour (X,Y,Z, [O 0]) A planet follows an elliptical orbit. Here are ten observations of its position in the (x, y) plane: x=[1.02 .95 .87 .77 .67 .56 .44 .30 .16 .01]'; y = [0.39 .32 .27 .22 .18 .15 .13 .12 .13 .15],; (a) Determine the coefficients in the quadratic form that fits these data in the least squares sense by setting one of the coefficients equal to one and solving a 10-by-5 overdetermined system of linear equations for the other five coefficients. Plot the orbit with x on the r-axis and y on the y-axis. Superimpose the ten data points on the plot (b) This least squares problem is nearly rank deficient. To see what effect this has on the solution, perturb the data slightly by adding to each coordinate of each data point a random number uniformly distributed in the interval -.0005,.0005]. Compute the new coefficients resulting from the perturbed data. Plot the new orbit on the same plot with the old orbit. Comment on your comparison of the sets of coefficients and the orbitsStep by Step Solution
There are 3 Steps involved in it
Step: 1

Get Instant Access to Expert-Tailored Solutions
See step-by-step solutions with expert insights and AI powered tools for academic success
Step: 2

Step: 3
Ace Your Homework with AI
Get the answers you need in no time with our AI-driven, step-by-step assistance
Get Started
Data Science Project Ideas In Health Care Volume 1
Authors: Zemelak Goraga
1st Edition
B0CPX2RWPF, 979-8223791072