

Answered step by step
Verified Expert Solution
Question
1 Approved Answer
From Data Mining and Machine Learning by Zaki and Meira. Chapter 12.4 question 4. Q4. Let D be a binary database spanning one trillion (109)
From Data Mining and Machine Learning by Zaki and Meira. Chapter 12.4 question 4.
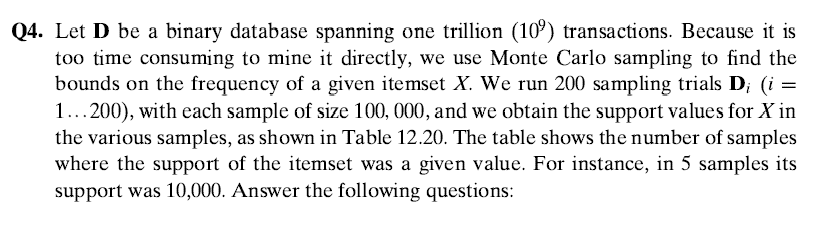
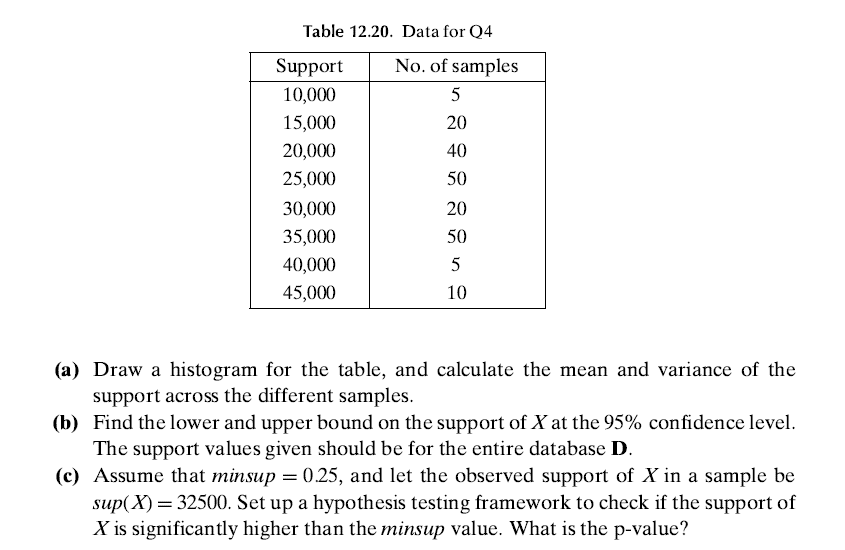
Q4. Let D be a binary database spanning one trillion (109) transactions. Because it is too time consuming to mine it directly, we use Monte Carlo sampling to find the bounds on the frequency of a given itemset X. We run 200 sampling trials D; (i = 1...200), with each sample of size 100,000, and we obtain the support values for X in the various samples, as shown in Table 12.20. The table shows the number of samples where the support of the itemset was a given value. For instance, in 5 samples its support was 10,000. Answer the following questions: Table 12.20. Data for Q4 Support No. of samples 10,000 5 15,000 20 20,000 40 25,000 50 30,000 20 35,000 50 40,000 5 45,000 10 (a) Draw a histogram for the table, and calculate the mean and variance of the support across the different samples. (b) Find the lower and upper bound on the support of X at the 95% confidence level. The support values given should be for the entire database D. (c) Assume that minsup = 0.25, and let the observed support of X in a sample be sup(X)= 32500. Set up a hypothesis testing framework to check if the support of X is significantly higher than the minsup value. What is the p-value? Q4. Let D be a binary database spanning one trillion (109) transactions. Because it is too time consuming to mine it directly, we use Monte Carlo sampling to find the bounds on the frequency of a given itemset X. We run 200 sampling trials D; (i = 1...200), with each sample of size 100,000, and we obtain the support values for X in the various samples, as shown in Table 12.20. The table shows the number of samples where the support of the itemset was a given value. For instance, in 5 samples its support was 10,000. Answer the following questions: Table 12.20. Data for Q4 Support No. of samples 10,000 5 15,000 20 20,000 40 25,000 50 30,000 20 35,000 50 40,000 5 45,000 10 (a) Draw a histogram for the table, and calculate the mean and variance of the support across the different samples. (b) Find the lower and upper bound on the support of X at the 95% confidence level. The support values given should be for the entire database D. (c) Assume that minsup = 0.25, and let the observed support of X in a sample be sup(X)= 32500. Set up a hypothesis testing framework to check if the support of X is significantly higher than the minsup value. What is the p-valueStep by Step Solution
There are 3 Steps involved in it
Step: 1

Get Instant Access to Expert-Tailored Solutions
See step-by-step solutions with expert insights and AI powered tools for academic success
Step: 2

Step: 3
Ace Your Homework with AI
Get the answers you need in no time with our AI-driven, step-by-step assistance
Get Started
Making Databases Work The Pragmatic Wisdom Of Michael Stonebraker
Authors: Michael L. Brodie
1st Edition
1947487167, 978-1947487161