Question
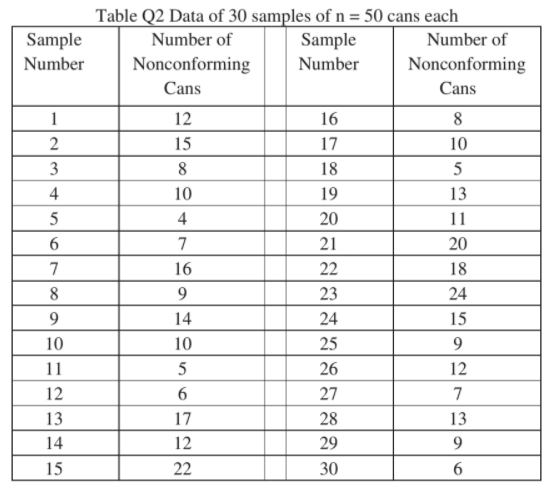
From further data analysis on data in Table Q2, it was found that sample 15 indicates that a new batch of cardboard stock was put
From further data analysis on data in Table Q2, it was found that sample 15 indicates that a new batch of cardboard stock was put into production during that half-hour period. The introduction of new batches of raw material sometimes causes irregular production performance, and it is reasonable to believe that this has occurred here. Furthermore, during the half-hour period in which sample 23 was obtained, a relatively inexperienced operator had been temporarily assigned to the machine, and this could account for the high fraction nonconforming obtained from that sample. Determine whether a new revised center line and a revised control chart to improve the fraction of nonconforming cans produced by this machine are necessary for the mentioned analysis. Justify your answer.

Step by Step Solution
There are 3 Steps involved in it
Step: 1

Get Instant Access to Expert-Tailored Solutions
See step-by-step solutions with expert insights and AI powered tools for academic success
Step: 2

Step: 3

Ace Your Homework with AI
Get the answers you need in no time with our AI-driven, step-by-step assistance
Get Started


