

Question
From the data shown in the table here, it contains historical monthly prices and dividends (paid at the end of the month) for Ford Motor
From the data shown in the table here,
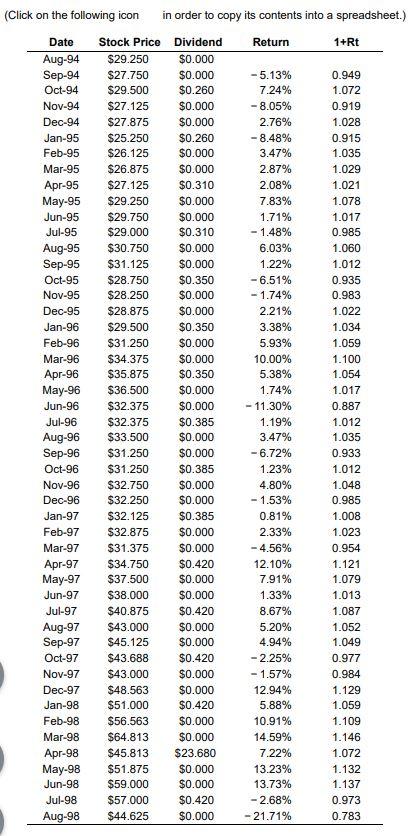
it contains historical monthly prices and dividends (paid at the end of the month) for Ford Motor Company stock (Ticker: F) from August 1994 to August 1998. Calculate the realized return over this period, expressing your answer in percent per month (i.e., what monthly return would have led to the same cumulative performance as an investment in Ford stock over this period).
How much is the total return? (in percentage)
(Click on the following icon in order to copy its contents into a spreadsheet.) Date Stock Price Dividend Return 1+Rt Aug-94 $29.250 $0.000 Sep-94 $27.750 $0.000 - 5.13% 0.949 Oct-94 $29.500 $0.260 7.24% 1.072 Nov-94 $27.125 $0.000 -8.05% 0.919 Dec-94 $27.875 $0.000 2.76% 1.028 Jan-95 $25.250 $0.260 -8.48% 0.915 Feb-95 $26.125 $0.000 3.47% 1.035 Mar-95 $26.875 $0.000 2.87% 1.029 Apr-95 $27.125 $0.310 2.08% 1.021 May-95 $29.250 $0.000 7.83% 1.078 Jun-95 $29.750 $0.000 1.71% 1.017 Jul-95 $29.000 $0.310 -1.48% 0.985 Aug-95 $30.750 $0.000 6.03% 1.060 Sep-95 $31.125 $0.000 1.22% 1.012 Oct-95 $28.750 $0.350 - 6.51% 0.935 Nov-95 $28.250 $0.000 -1.74% 0.983 Dec-95 $28.875 $0.000 2.21% 1.022 Jan-96 $29.500 $0.350 3.38% 1.034 Feb-96 $31.250 $0.000 5.93% 1.059 Mar-96 $34.375 $0.000 10.00% 1.100 Apr-96 $35.875 $0.350 5.38% 1.054 May-96 $36.500 $0.000 1.74% 1.017 Jun-96 $32.375 $0.000 -11.30% 0.887 Jul-96 $32.375 $0.385 1.19% 1.012 Aug-96 $33.500 $0.000 3.47% 1.035 Sep-96 $31.250 $0.000 -6.72% 0.933 Oct-96 $31.250 $0.385 1.23% 1.012 Nov-96 $32.750 $0.000 4.80% 1.048 Dec-96 $32.250 $0.000 - 1.53% 0.985 Jan-97 $32.125 $0.385 0.81% 1.008 Feb-97 $32.875 $0.000 2.33% 1.023 Mar-97 $31.375 $0.000 -4.56% 0.954 Apr-97 $34.750 $0.420 12.10% 1.121 May-97 $37.500 $0.000 7.91% 1.079 Jun-97 $38.000 $0.000 1.33% 1.013 $40.875 $0.420 8.67% 1.087 Jul-97 Aug-97 $43.000 $0.000 5.20% 1.052 Sep-97 $45.125 $0.000 4.94% 1.049 Oct-97 $43.688 $0.420 -2.25% 0.977 Nov-97 $43.000 $0.000 - 1.57% 0.984 Dec-97 $48.563 $0.000 12.94% 1.129 Jan-98 $51.000 $0.420 5.88% 1.059 Feb-98 $56.563 $0.000 10.91% 1.109 Mar-98 $64.813 $0.000 14.59% 1.146 Apr-98 $45.813 $23.680 7.22% 1.072 May-98 $51.875 $0.000 13.23% 1.132 Jun-98 $59.000 $0.000 13.73% 1.137 Jul-98 $57.000 $0.420 -2.68% 0.973 Aug-98 $44.625 $0.000 - 21.71% 0.783 (Click on the following icon in order to copy its contents into a spreadsheet.) Date Stock Price Dividend Return 1+Rt Aug-94 $29.250 $0.000 Sep-94 $27.750 $0.000 - 5.13% 0.949 Oct-94 $29.500 $0.260 7.24% 1.072 Nov-94 $27.125 $0.000 -8.05% 0.919 Dec-94 $27.875 $0.000 2.76% 1.028 Jan-95 $25.250 $0.260 -8.48% 0.915 Feb-95 $26.125 $0.000 3.47% 1.035 Mar-95 $26.875 $0.000 2.87% 1.029 Apr-95 $27.125 $0.310 2.08% 1.021 May-95 $29.250 $0.000 7.83% 1.078 Jun-95 $29.750 $0.000 1.71% 1.017 Jul-95 $29.000 $0.310 -1.48% 0.985 Aug-95 $30.750 $0.000 6.03% 1.060 Sep-95 $31.125 $0.000 1.22% 1.012 Oct-95 $28.750 $0.350 - 6.51% 0.935 Nov-95 $28.250 $0.000 -1.74% 0.983 Dec-95 $28.875 $0.000 2.21% 1.022 Jan-96 $29.500 $0.350 3.38% 1.034 Feb-96 $31.250 $0.000 5.93% 1.059 Mar-96 $34.375 $0.000 10.00% 1.100 Apr-96 $35.875 $0.350 5.38% 1.054 May-96 $36.500 $0.000 1.74% 1.017 Jun-96 $32.375 $0.000 -11.30% 0.887 Jul-96 $32.375 $0.385 1.19% 1.012 Aug-96 $33.500 $0.000 3.47% 1.035 Sep-96 $31.250 $0.000 -6.72% 0.933 Oct-96 $31.250 $0.385 1.23% 1.012 Nov-96 $32.750 $0.000 4.80% 1.048 Dec-96 $32.250 $0.000 - 1.53% 0.985 Jan-97 $32.125 $0.385 0.81% 1.008 Feb-97 $32.875 $0.000 2.33% 1.023 Mar-97 $31.375 $0.000 -4.56% 0.954 Apr-97 $34.750 $0.420 12.10% 1.121 May-97 $37.500 $0.000 7.91% 1.079 Jun-97 $38.000 $0.000 1.33% 1.013 $40.875 $0.420 8.67% 1.087 Jul-97 Aug-97 $43.000 $0.000 5.20% 1.052 Sep-97 $45.125 $0.000 4.94% 1.049 Oct-97 $43.688 $0.420 -2.25% 0.977 Nov-97 $43.000 $0.000 - 1.57% 0.984 Dec-97 $48.563 $0.000 12.94% 1.129 Jan-98 $51.000 $0.420 5.88% 1.059 Feb-98 $56.563 $0.000 10.91% 1.109 Mar-98 $64.813 $0.000 14.59% 1.146 Apr-98 $45.813 $23.680 7.22% 1.072 May-98 $51.875 $0.000 13.23% 1.132 Jun-98 $59.000 $0.000 13.73% 1.137 Jul-98 $57.000 $0.420 -2.68% 0.973 Aug-98 $44.625 $0.000 - 21.71% 0.783Step by Step Solution
There are 3 Steps involved in it
Step: 1

Get Instant Access to Expert-Tailored Solutions
See step-by-step solutions with expert insights and AI powered tools for academic success
Step: 2

Step: 3
Ace Your Homework with AI
Get the answers you need in no time with our AI-driven, step-by-step assistance
Get Started
History Of Financial Institutions Essays On The History Of European Finance 1800–1950
Authors: Carmen Hofmann , Martin L. Müller
1st Edition
1138325007, 978-1138325005