Answered step by step
Verified Expert Solution
Link Copied!

Question

1 Approved Answer

From the following analysis answer the points related to this section Analysis types Data/year 1 3 4 : W N Sales 60% 88% 53% 74%

image text in transcribedimage text in transcribedimage text in transcribed

From the following analysis answer the points related to this section Analysis types Data/year 1 3 4 : W N Sales 60% 88% 53% 74% Year-to-year analysis Cost of goods sold 150% 60% 38% 36% Gross profit 0% 133% 71% 108% Common size Sales 100% 100% 100% 100% 100% analysis Cost of goods sold 70% 63% 53% 48% 38% Gross profit 30% 38% 47% 52% 63% if the sales in the first year equal $100, the sales in the 4th year must be equal nearly $33 $133 $50 O $460 if the sales in the 4th year is equal $300, the cost of goods sold for the 4th year must be equal nearly $100 $71 O $120 O $144 from the data belonging to this section we can reach to the following general * result decrease sales ratio sales ratio is grow more than cost of goods sold ratio decrease cost of goods ratio sable in profit ratio

Step by Step Solution

There are 3 Steps involved in it

Step: 1

blur-text-image

Get Instant Access to Expert-Tailored Solutions

See step-by-step solutions with expert insights and AI powered tools for academic success

Step: 2

blur-text-image

Step: 3

blur-text-image

Ace Your Homework with AI

Get the answers you need in no time with our AI-driven, step-by-step assistance

Get Started

Recommended Textbook for

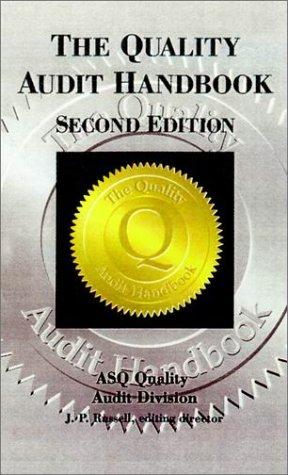
The Quality Audit Handbook

Authors: Asq Quality Audit Division, J. P. Russell

2nd Edition

087389460X, 978-0873894609

More Books

Students also viewed these Accounting questions