Answered step by step
Verified Expert Solution
Link Copied!

Question

1 Approved Answer

From the given ratio calculation can you explain whether to invest in this company or not? and limitations. A. LIQUIDITY RATIOS 1. Current Ratio 2019

From the given ratio calculation can you explain whether to invest in this company or not? and limitations. image text in transcribed
image text in transcribed
A. LIQUIDITY RATIOS 1. Current Ratio 2019 2018 Current Assets Current Liabilities 6298 8620 7014 9029 0.73062645 0.776830214 2. Quick Ratio 2019 2018 Quick assets Current Liabilities 2018 8620 2781 9029 23.4106729 30.80075313 3. Receivables Turnover 2019 2018 Net credit sales Average net trade receivables 59984 741.5 56726 772.85 80.8954821 73.39846024 B. SOLVENCY RATIOS 1. Debt to total Assets Ratio 2019 2018 Total Liabilities Total Assets 12822 23491 12542 23391 54.5826061 53.61891326 2. Times interest earned 2019 2018 Earning before interest and tax Interest expense 2353 126 2548 154 18.6746032 16.54545455 3. Cash debt coverage 2019 2018 Net cash provided by operating activities Average total liabilities 2948 12682 2994 12938 23.2455449 23.14113464 1. Return on assets 2019 2018 Profit after tax Average total asstes 2759 23441 1795 23217 11.7699757 7.731403713 2. Profit Margin 2019 2018 Profit after tax Net Sales 2759 59984 1795 56944 4.59955988 3.152219725 3. Asset turnover 2019 2018 Net sales Average total assets 59984 23441 56944 46434 2.5589352 1.226342766 3

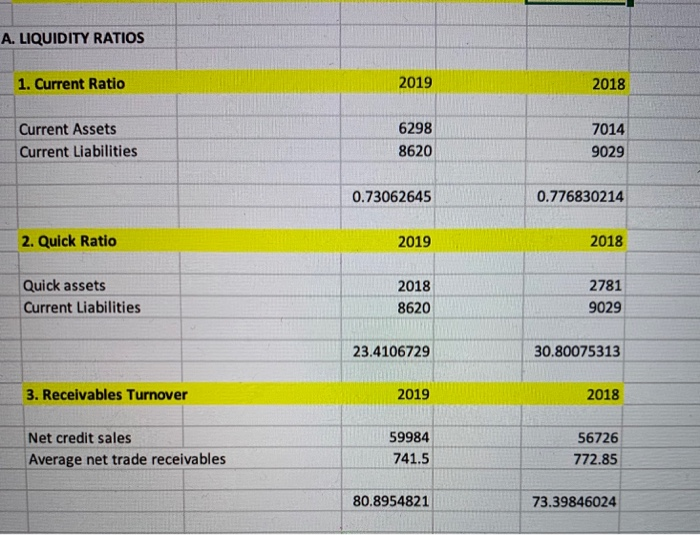
Step by Step Solution

There are 3 Steps involved in it

Step: 1

blur-text-image

Get Instant Access to Expert-Tailored Solutions

See step-by-step solutions with expert insights and AI powered tools for academic success

Step: 2

blur-text-image

Step: 3

blur-text-image

Ace Your Homework with AI

Get the answers you need in no time with our AI-driven, step-by-step assistance

Get Started

Students also viewed these Accounting questions