Answered step by step
Verified Expert Solution
Question
1 Approved Answer
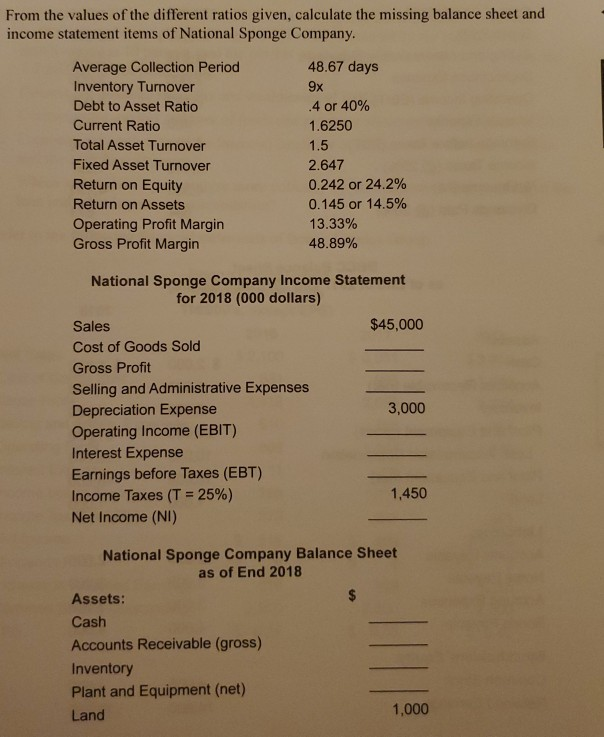
From the values of the different ratios given, calculate the missing balance sheet and income statement items of National Sponge Company. Average Collection Period Inventory


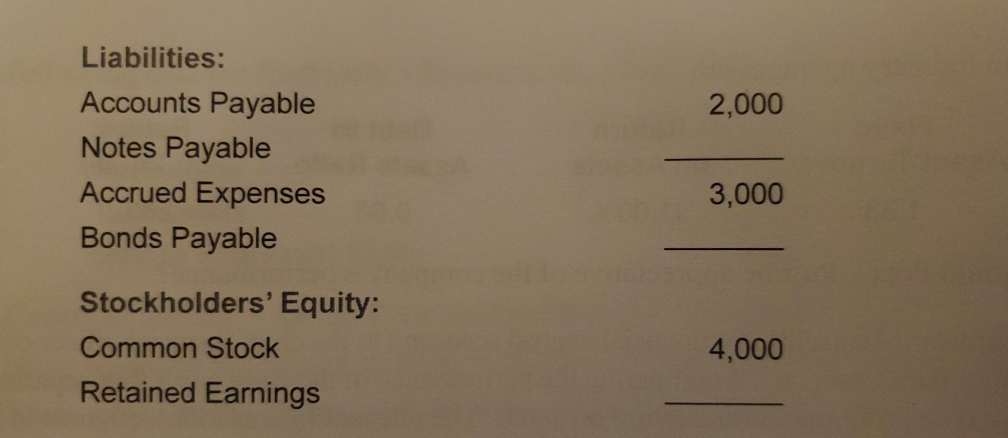
From the values of the different ratios given, calculate the missing balance sheet and income statement items of National Sponge Company. Average Collection Period Inventory Turnover Debt to Asset Ratio Current Ratio Total Asset Turnover Fixed Asset Turnover Return on Equity Return on Assets Operating Profit Margin Gross Profit Margin 48.67 days 9x 4 or 40% 1.6250 1.5 2.647 0.242 or 24.2% 0.145 or 14.5% 13.33% 48.89% National Sponge Company Income Statement for 2018 (000 dollars) Sales $45,000 Cost of Goods Sold Gross Profit Selling and Administrative Expenses Depreciation Expense 3,000 Operating Income (EBIT) Interest Expense Earnings before Taxes (EBT) Income Taxes (T = 25%) 1,450 Net Income (NI) National Sponge Company Balance Sheet as of End 2018 Assets: Cash Accounts Receivable (gross) Inventory Plant and Equipment (net) Land 1,000 2,000 Liabilities: Accounts Payable Notes Payable Accrued Expenses Bonds Payable 3,000 Stockholders' Equity: Common Stock Retained Earnings 4,000
Step by Step Solution
There are 3 Steps involved in it
Step: 1

Get Instant Access to Expert-Tailored Solutions
See step-by-step solutions with expert insights and AI powered tools for academic success
Step: 2

Step: 3

Ace Your Homework with AI
Get the answers you need in no time with our AI-driven, step-by-step assistance
Get Started


