FSA memo, ratios are done

hope this helps here is the instructions and incomplete ratios
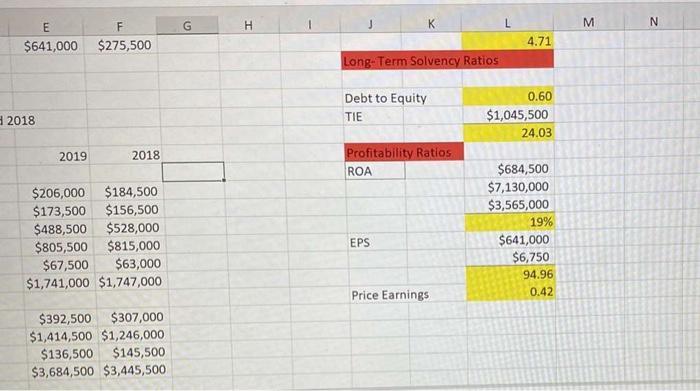
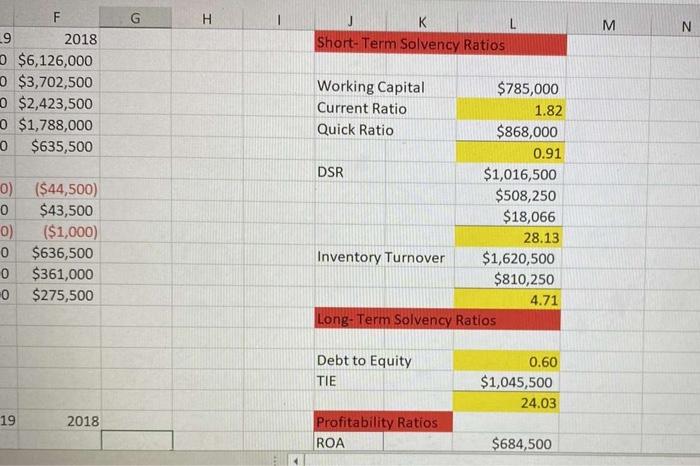
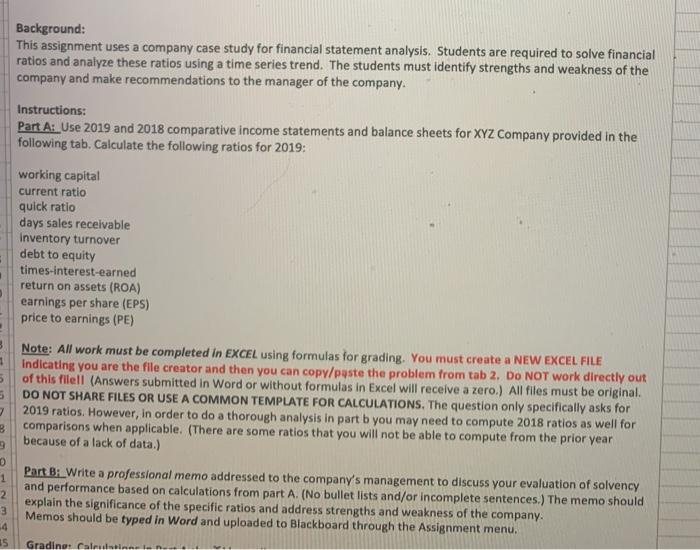
Background: This assignment uses a company case study for financial statement analysis. Students are required to solve financial ratios and analyze these ratios using a time series trend. The students must identify strengths and weakness of the company and make recommendations to the manager of the company. Instructions: Part A: Use 2019 and 2018 comparative income statements and balance sheets for XYZ Company provided in the following tab. Calculate the following ratios for 2019: working capital current ratio quick ratio days sales receivable Inventory turnover debt to equity times-interest-earned return on assets (ROA) earnings per share (EPS) price to earnings (PE) 7 Note: All work must be completed in EXCEL using formulas for grading. You must create a NEW EXCEL FILE 1 Indicating you are the file creator and then you can copy/paste the problem from tab 2. Do NOT work directly out 5 of this filell (Answers submitted in Word or without formulas in Excel will receive a zero.) All files must be original. 5 DO NOT SHARE FILES OR USE A COMMON TEMPLATE FOR CALCULATIONS. The question only specifically asks for 2019 ratios. However, in order to do a thorough analysis in part b you may need to compute 2018 ratios as well for B comparisons when applicable. (There are some ratios that you will not be able to compute from the prior year because of a lack of data.) Part B: Write a professional memo addressed to the company's management to discuss your evaluation of solvency 1 and performance based on calculations from part A. (No bullet lists and/or incomplete sentences.) The memo should 2 explain the significance of the specific ratios and address strengths and weakness of the company. 3 Memos should be typed in Word and uploaded to Blackboard through the Assignment menu, 4 15 Gradina: Calentine H G K L M N E F $641,000 $275,500 4.71 Long-Term Solvency Ratios Debt to Equity 0.60 $1,045,500 2018 TIE 24.03 2019 2018 Profitability Ratios ROA $206,000 $184,500 $173,500 $156,500 $488,500 $528,000 $805,500 $815,000 $67,500 $63,000 $1,741,000 $1,747,000 $684,500 $7,130,000 $3,565,000 19% $641,000 $6,750 94.96 0.42 EPS Price Earnings $392,500 $307,000 $1,414,500 $1,246,000 $136,500 $145,500 $3,684,500 $3,445,500 G H J L Short-Term Solvency Ratios M N F 9 2018 $6,126,000 $3,702,500 $2,423,500 0 $1,788,000 0 $635,500 0) ($44,500) 0 $43,500 0) ($1,000) 0 $636,500 0 $361,000 0 $275,500 Working Capital $785,000 Current Ratio 1.82 Quick Ratio $868,000 0.91 DSR $1,016,500 $508,250 $18,066 28.13 Inventory Turnover $1,620,500 $810,250 4.71 Long-Term Solvency Ratios Debt to Equity TIE 0.60 $1,045,500 24.03 19 2018 Profitability Ratios ROA $684,500 Instructions: Comparative income statements and balance sheets for XYZ Company follow for 2019 and 2018 XYZ Comparative Income Statements December 31, 2019 and 2018 2019 6,594,000 3,812.500 2.781,500 1,788,000 993,500 2018 6,126.000 3,702.500 2.421 Sool 1.788.000 635,500 Sales Cost of goods sold Grossprache Selling and administrative expenses Operating income Other expenses (revenues) Interest revenue Interest expense Total other expenses revenos) Income before income taxes Income taxes Net Incom 44.500 43.500 -52,000 43,500 -8.500 1,002,000 361 000 641,000 636.500 361.000 275.500 XYZ Company Comparative Balance Sheets For Years Ended December 31, 2019 and 2018 2019 2018 Assets Cash Marketable securities Accounts receivable Inventory Prepaid expenses Total current assets 206,000 173.500 488,500 805,500 67,500 1,741,000 184.500 156.500 $28.000 $15.000 63.000 1,747.000 Investments and other assets Property, plant, and equipment, net Trademarks and other intangibles Total assets 392.500 1,414,500 136.500 3,684,500 307.000 1.246,000 145.500 1.445.500 Liabilities and stockholders' equity Current maturities of long-term debt Accounts payable and hiccued expenses Total current liabilities 40,000 916,000 956,000 12.500 971.500 984.000 94.500 Notes payable Long-term debet Total liabities 333,000 92.500 274.500 1.351.000 1,383,500 Common stock, SIO par value Additional paid-in capital Retainedcmings Total stockholders' equity Total liabilities and stockholders' equity 67,500 119,000 2.114,500 2.301.000 3.684.500 67.500 TIR.000 1.900.000 2.094.500 3.445.500 Additional Company Information Market valse (stock price) of common stock: 540 in 2019 and 30 in 2018 Credil temps n 30 days 2018 Days Sales Receivable 32 days 2018 Invertory Tumover. 5 times Industry As crage for Inventory Turnover: 4.5 times Bank requires a Times Interest Emmed Ratio of 10 Industry Aerage for HOA: 12% Background: This assignment uses a company case study for financial statement analysis. Students are required to solve financial ratios and analyze these ratios using a time series trend. The students must identify strengths and weakness of the company and make recommendations to the manager of the company. Instructions: Part A: Use 2019 and 2018 comparative income statements and balance sheets for XYZ Company provided in the following tab. Calculate the following ratios for 2019: working capital current ratio quick ratio days sales receivable Inventory turnover debt to equity times-interest-earned return on assets (ROA) earnings per share (EPS) price to earnings (PE) 7 Note: All work must be completed in EXCEL using formulas for grading. You must create a NEW EXCEL FILE 1 Indicating you are the file creator and then you can copy/paste the problem from tab 2. Do NOT work directly out 5 of this filell (Answers submitted in Word or without formulas in Excel will receive a zero.) All files must be original. 5 DO NOT SHARE FILES OR USE A COMMON TEMPLATE FOR CALCULATIONS. The question only specifically asks for 2019 ratios. However, in order to do a thorough analysis in part b you may need to compute 2018 ratios as well for B comparisons when applicable. (There are some ratios that you will not be able to compute from the prior year because of a lack of data.) Part B: Write a professional memo addressed to the company's management to discuss your evaluation of solvency 1 and performance based on calculations from part A. (No bullet lists and/or incomplete sentences.) The memo should 2 explain the significance of the specific ratios and address strengths and weakness of the company. 3 Memos should be typed in Word and uploaded to Blackboard through the Assignment menu, 4 15 Gradina: Calentine H G K L M N E F $641,000 $275,500 4.71 Long-Term Solvency Ratios Debt to Equity 0.60 $1,045,500 2018 TIE 24.03 2019 2018 Profitability Ratios ROA $206,000 $184,500 $173,500 $156,500 $488,500 $528,000 $805,500 $815,000 $67,500 $63,000 $1,741,000 $1,747,000 $684,500 $7,130,000 $3,565,000 19% $641,000 $6,750 94.96 0.42 EPS Price Earnings $392,500 $307,000 $1,414,500 $1,246,000 $136,500 $145,500 $3,684,500 $3,445,500 G H J L Short-Term Solvency Ratios M N F 9 2018 $6,126,000 $3,702,500 $2,423,500 0 $1,788,000 0 $635,500 0) ($44,500) 0 $43,500 0) ($1,000) 0 $636,500 0 $361,000 0 $275,500 Working Capital $785,000 Current Ratio 1.82 Quick Ratio $868,000 0.91 DSR $1,016,500 $508,250 $18,066 28.13 Inventory Turnover $1,620,500 $810,250 4.71 Long-Term Solvency Ratios Debt to Equity TIE 0.60 $1,045,500 24.03 19 2018 Profitability Ratios ROA $684,500 Instructions: Comparative income statements and balance sheets for XYZ Company follow for 2019 and 2018 XYZ Comparative Income Statements December 31, 2019 and 2018 2019 6,594,000 3,812.500 2.781,500 1,788,000 993,500 2018 6,126.000 3,702.500 2.421 Sool 1.788.000 635,500 Sales Cost of goods sold Grossprache Selling and administrative expenses Operating income Other expenses (revenues) Interest revenue Interest expense Total other expenses revenos) Income before income taxes Income taxes Net Incom 44.500 43.500 -52,000 43,500 -8.500 1,002,000 361 000 641,000 636.500 361.000 275.500 XYZ Company Comparative Balance Sheets For Years Ended December 31, 2019 and 2018 2019 2018 Assets Cash Marketable securities Accounts receivable Inventory Prepaid expenses Total current assets 206,000 173.500 488,500 805,500 67,500 1,741,000 184.500 156.500 $28.000 $15.000 63.000 1,747.000 Investments and other assets Property, plant, and equipment, net Trademarks and other intangibles Total assets 392.500 1,414,500 136.500 3,684,500 307.000 1.246,000 145.500 1.445.500 Liabilities and stockholders' equity Current maturities of long-term debt Accounts payable and hiccued expenses Total current liabilities 40,000 916,000 956,000 12.500 971.500 984.000 94.500 Notes payable Long-term debet Total liabities 333,000 92.500 274.500 1.351.000 1,383,500 Common stock, SIO par value Additional paid-in capital Retainedcmings Total stockholders' equity Total liabilities and stockholders' equity 67,500 119,000 2.114,500 2.301.000 3.684.500 67.500 TIR.000 1.900.000 2.094.500 3.445.500 Additional Company Information Market valse (stock price) of common stock: 540 in 2019 and 30 in 2018 Credil temps n 30 days 2018 Days Sales Receivable 32 days 2018 Invertory Tumover. 5 times Industry As crage for Inventory Turnover: 4.5 times Bank requires a Times Interest Emmed Ratio of 10 Industry Aerage for HOA: 12%