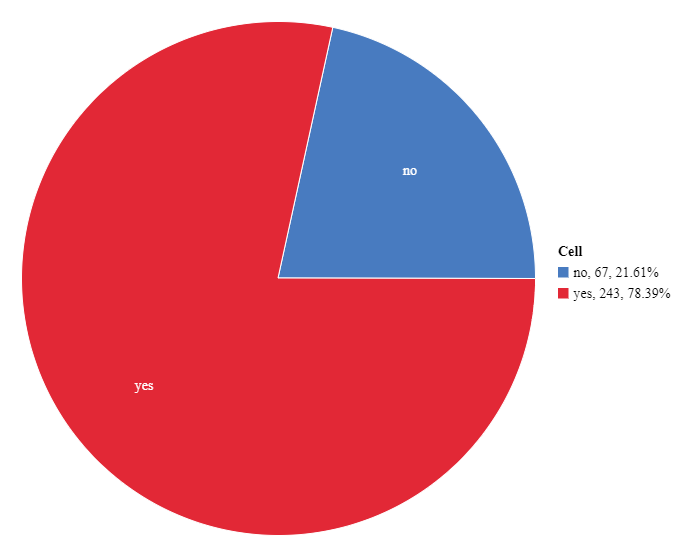
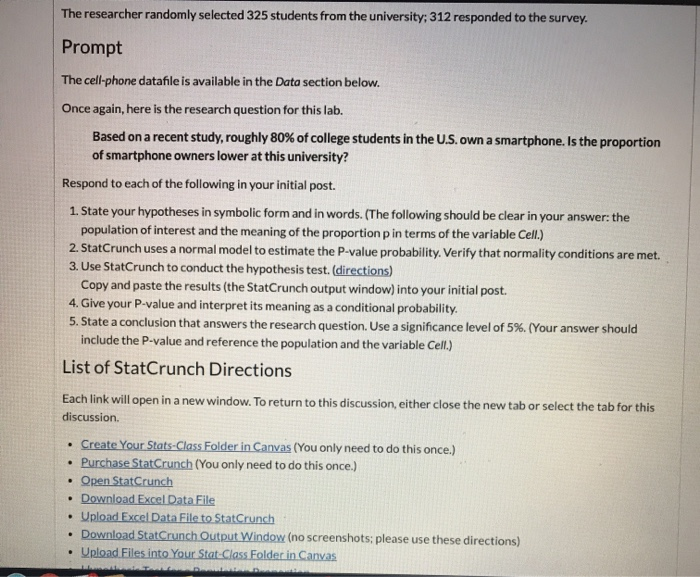
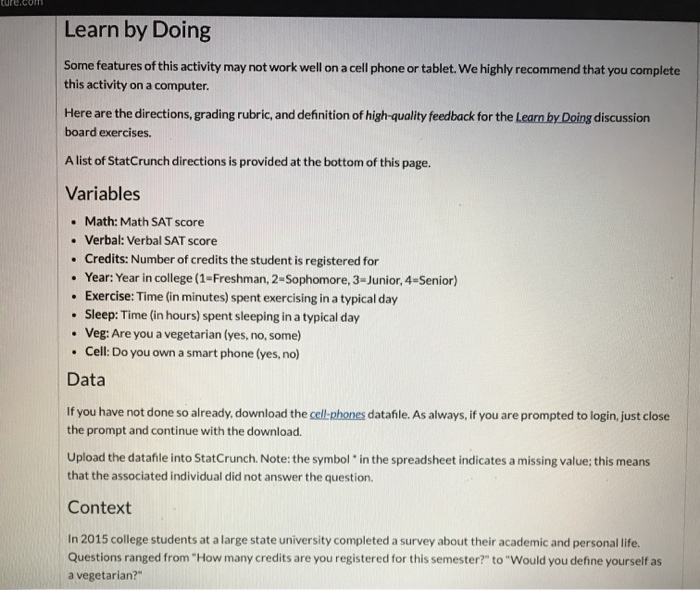
\fThe researcher randomly selected 325 students from the university; 312 responded to the survey. Prompt The cell-phone datafile is available in the Data section below. Once again, here is the research question for this lab. Based on a recent study, roughly 80% of college students in the U.S. own a smartphone. Is the proportion of smartphone owners lower at this university? Respond to each of the following in your initial post. 1. State your hypotheses in symbolic form and in words. (The following should be clear in your answer: the population of interest and the meaning of the proportion p in terms of the variable Cell.) 2. StatCrunch uses a normal model to estimate the P-value probability. Verify that normality conditions are met. 3. Use StatCrunch to conduct the hypothesis test. (directions) Copy and paste the results (the StatCrunch output window) into your initial post. 4. Give your P-value and interpret its meaning as a conditional probability. 5. State a conclusion that answers the research question. Use a significance level of 5%. (Your answer should include the P-value and reference the population and the variable Cell.) List of StatCrunch Directions Each link will open in a new window. To return to this discussion, either close the new tab or select the tab for this discussion. . Create Your Stats-Class Folder in Canvas (You only need to do this once.) . Purchase StatCrunch (You only need to do this once.) . Open StatCrunch Download Excel Data File . Upload Excel Data File to StatCrunch Download StatCrunch Output Window (no screenshots; please use these directions) Upload Files into Your Stat-Class Folder in CanvasLearn by Doing Some features of this activity may not work well on a cell phone or tablet. We highly recommend that you complete this activity on a computer. Here are the directions, grading rubric, and definition of high-quality feedback for the Learn by Doing discussion board exercises. A list of StatCrunch directions is provided at the bottom of this page. Variables . Math: Math SAT score . Verbal: Verbal SAT score . Credits: Number of credits the student is registered for . Year: Year in college (1=Freshman, 2-Sophomore, 3-Junior, 4=Senior) . Exercise: Time (in minutes) spent exercising in a typical day Sleep: Time (in hours) spent sleeping in a typical day . Veg: Are you a vegetarian (yes, no, some) . Cell: Do you own a smart phone (yes, no) Data If you have not done so already, download the cell-phones datafile. As always, if you are prompted to login, just close the prompt and continue with the download. Upload the datafile into StatCrunch. Note: the symbol * in the spreadsheet indicates a missing value; this means that the associated individual did not answer the question. Context In 2015 college students at a large state university completed a survey about their academic and personal life. Questions ranged from "How many credits are you registered for this semester?" to "Would you define yourself as a vegetarian?"