Question
Fujita, Incorporated, has no debt outstanding and a total market value of $280,000. Earnings before interest and taxes, EBIT, are projected to be $22,000 if
| Fujita, Incorporated, has no debt outstanding and a total market value of $280,000. Earnings before interest and taxes, EBIT, are projected to be $22,000 if economic conditions are normal. If there is strong expansion in the economy, then EBIT will be 12 percent higher. If there is a recession, then EBIT will be 30 percent lower. The company is considering a debt issue of $65,000 with an interest rate of 8 percent. The proceeds will be used to repurchase shares of stock. There are currently 7,000 shares outstanding. Ignore taxes for this problem. Assume the stock price is constant under all scenarios. |
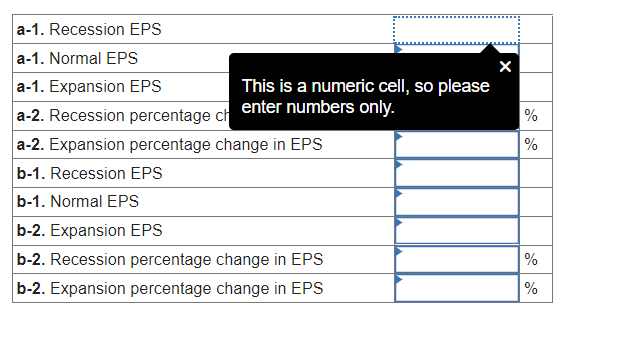
| a-1. | Calculate earnings per share (EPS) under each of the three economic scenarios before any debt is issued. (Do not round intermediate calculations and round your answers to 2 decimal places, e.g., 32.16.) |
| a-2. | Calculate the percentage changes in EPS when the economy expands or enters a recession. (A negative answer should be indicated by a minus sign. Do not round intermediate calculations and enter your answers as a percent rounded to 2 decimal places, e.g., 32.16.) |
| b-1. | Calculate earnings per share (EPS) under each of the three economic scenarios assuming the company goes through with recapitalization. (Do not round intermediate calculations and round your answers to 2 decimal places, e.g., 32.16.) |
| b-2. | Given the recapitalization, calculate the percentage changes in EPS when the economy expands or enters a recession. (A negative answer should be indicated by a minus sign. Do not round intermediate calculations and enter your answers as a percent rounded to 2 decimal places, e.g., 32.16.) |

Step by Step Solution
There are 3 Steps involved in it
Step: 1

Get Instant Access to Expert-Tailored Solutions
See step-by-step solutions with expert insights and AI powered tools for academic success
Step: 2

Step: 3

Ace Your Homework with AI
Get the answers you need in no time with our AI-driven, step-by-step assistance
Get Started


