

Question
Full balance sheet Griffin Industries, Inc. Comparative Balance Sheets December 31, 2017 and 2016 Assets 2017 2016 Current assets: Cash $470,000 $287,000 Accounts receivable 70,000
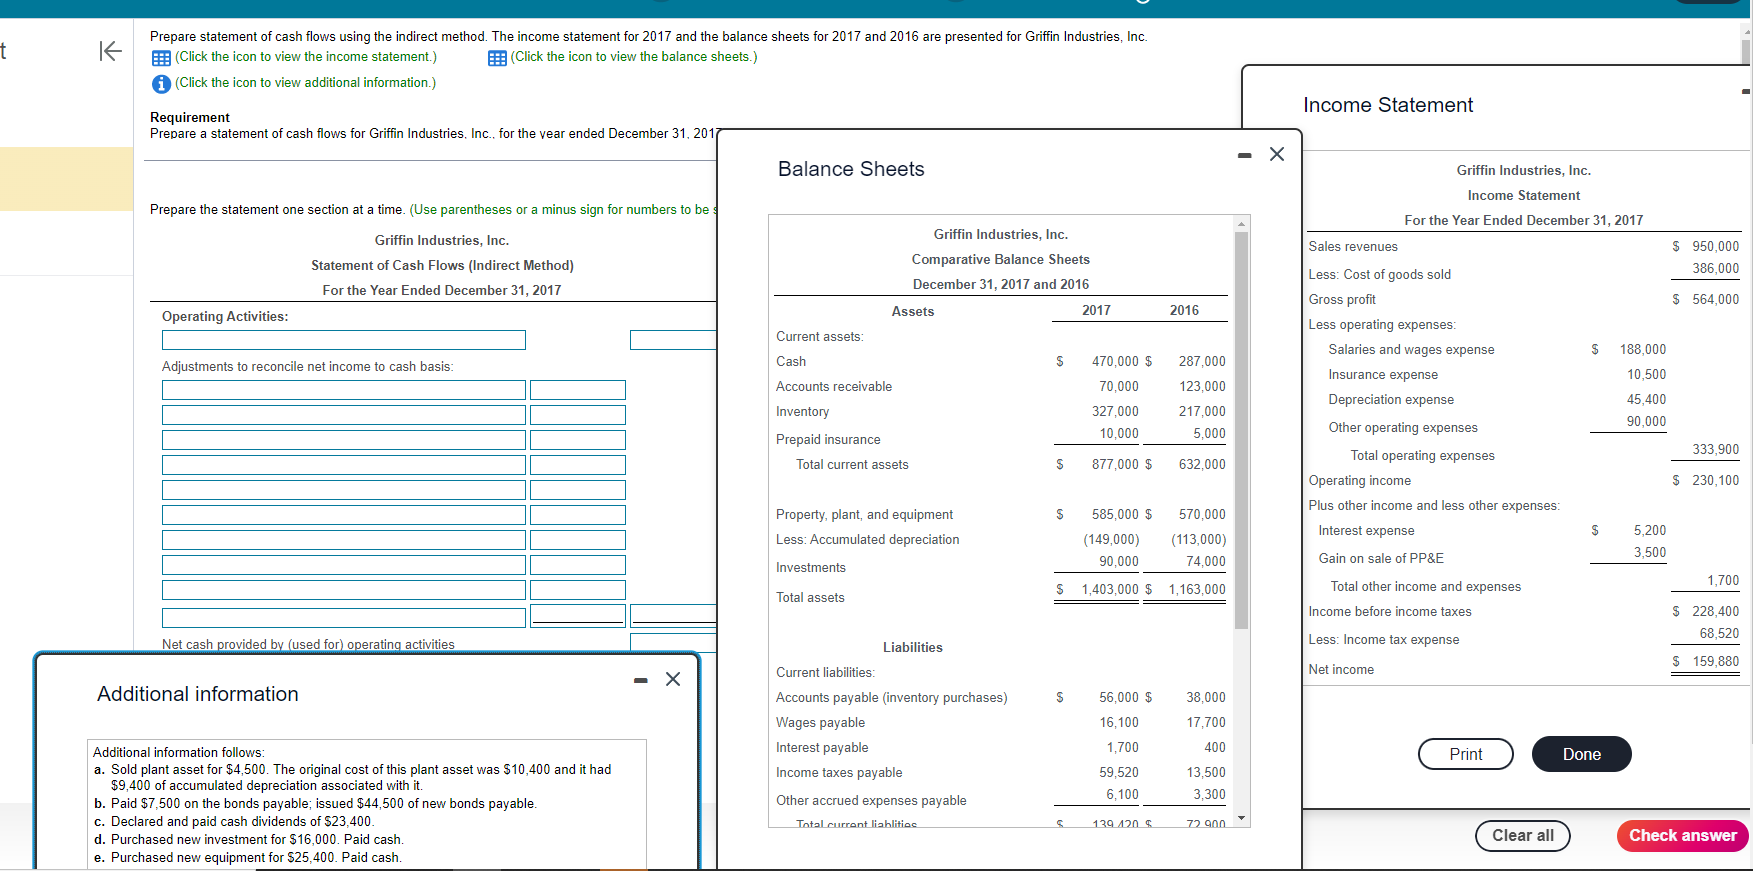
Full balance sheet
Griffin Industries, Inc.
Comparative Balance Sheets
December 31, 2017 and 2016
Assets
2017
2016
Current assets:
Cash
$470,000
$287,000
Accounts receivable
70,000
123,000
Inventory
327,000
217,000
Prepaid insurance
10,000
5,000
Total current assets
$877,000
$632,000
Property, plant, and equipment
$585,000
$570,000
Less: Accumulated depreciation
(149,000)
(113,000)
Investments
90,000
74,000
Total assets
$1,403,000
$1,163,000
Liabilities
Current liabilities:
Accounts payable (inventory purchases)
$56,000
$38,000
Wages payable
16,100
17,700
Interest payable
1,700
400
Income taxes payable
59,520
13,500
Other accrued expenses payable
6,100
3,300
Total current liablities
$139,420
$72,900
Long-term liabilities
64,000
27,000
Total liabilities
$203,420
$99,900
Stockholders' equity
Common stock
$603,000
$603,000
Retained earnings
596,580
460,100
Total stockholders' equity
$1,199,580
$1,063,100
Total liabilities and equity
$1,403,000
$1,163,000
Additional information Additional information follows: a. Sold plant asset for $4,500. The original cost of this plant asset was $10,400 and it had $9,400 of accumulated depreciation associated with it. b. Paid $7,500 on the bonds payable; issued $44,500 of new bonds payable. c. Declared and paid cash dividends of $23,400. d. Purchased new investment for $16,000. Paid cash. e. Purchased new equipment for $25,400. Paid cashStep by Step Solution
There are 3 Steps involved in it
Step: 1

Get Instant Access to Expert-Tailored Solutions
See step-by-step solutions with expert insights and AI powered tools for academic success
Step: 2

Step: 3
Ace Your Homework with AI
Get the answers you need in no time with our AI-driven, step-by-step assistance
Get Started
Cost management a strategic approach
Authors: Edward J. Blocher, David E. Stout, Gary Cokins
5th edition
73526940, 978-0073526942