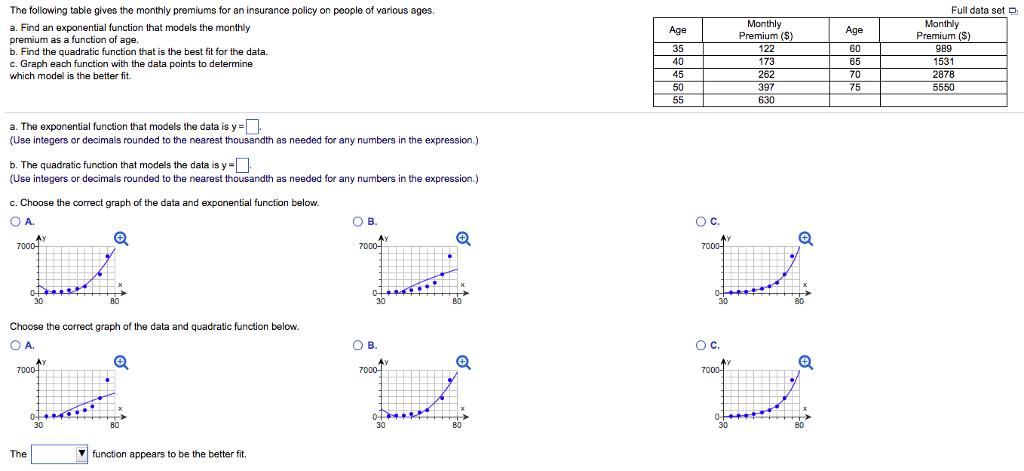
Full data set D Monthly Premium (S) The following table gives the monthly premiums for an insurance policy on people of various ages. a.

Full data set D Monthly Premium (S) The following table gives the monthly premiums for an insurance policy on people of various ages. a. Find an exponential function that models the monthily premium as a function of age. b. Find the quadratic function that is the best fit for the data. c. Graph each function with the data points to determine which model is the better fit. Monthly Premium ($) 122 Age Age 35 60 989 40 173 65 1531 45 262 70 2878 50 397 75 5550 55 630 a. The exponential function that models the data is y = (Use integers or decimals rounded to the nearest thousandth as needed for any numbers in the expression.) b. The quadratic function that models the data isy = (Use integers or decimals rounded to the nearest thousandth as needed for any numbers in the expression.) c. Choose the correct graph of the data and exponential function below. O A. OB. AY 7000- Ay 7000- 7000- 30 B0 30 Choose the correct graph of the data and quadratic function below. O A. O B. Oc. Ay 7000- Ay 7000 7000- 30 30 The V function appears to be the better fit.
Step by Step Solution
3.46 Rating (162 Votes )
There are 3 Steps involved in it
Step: 1

See step-by-step solutions with expert insights and AI powered tools for academic success
Step: 2

Step: 3

Ace Your Homework with AI
Get the answers you need in no time with our AI-driven, step-by-step assistance
Get Started


