Question
Fun Bulb, Co. has been expanding quite rapidly and ventured into a newly developed materials for their products at the end of 2018. At that
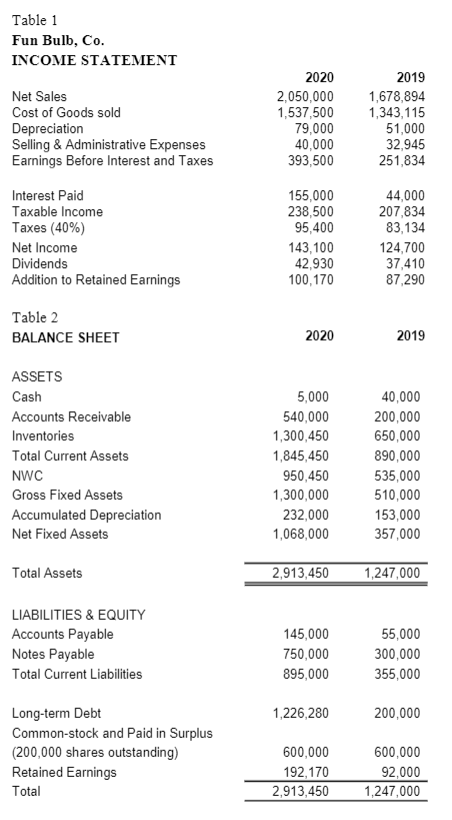
Fun Bulb, Co. has been expanding quite rapidly and ventured into a newly developed materials for their products at the end of 2018. At that time, the future outlook seemed very promising and the economy was stable. Stock price per share was $7. The overall competitive pressure was not too severe. Due to this expectation, the firm built two new manufacturing plants and significantlyincreased its inventory.Now it is the end of 2020. Fun Bulb had a quite a jump in profits over the past few years.However, when Mary Stuart, the Assistant to the CFO at Fun Bulb, looked at the accounting statements for 2020, she was not happy to see the lower profitability shown in the statements. There was also a big concern on the significant drop in the cash balance of the firm. Mary knew that the stockholders would be very concerned when these statementsare released. She also knew that her boss, the CFO, would need to come up with some reasonable answers for the cash issue. The cash balance issue isof particular importance because the firm is planning on raising some short-term capital in the recent future. The current stock price per share at the end of 2020is $5.50. Given Table 1 and 2 below (Income Statement and Balance Sheet for the recent two years), Mary needs to do some basic cash flow and financial ratio analysis and provide suggestions to her boss. Please help her by answering the following 6 questions.

1.For 2020and 2019respectively, calculate net profit margin, interest expense ($), and interest coverage ratio.
2.Calculate for 2020and 2019respectively, the cash ratio, current ratio, quick ratio, NWC to TA, interval ratio(or BDI), and NWC ($).
3.Market value of stock = number of shares * price per share for 2020. Book value of equity = common stock and paid in surplus + retained earnings in 2020
5.2020FCF = 2020NOPLAT + 2020Depreciation 2020net investmentNOPLAT = EBIT taxesNet investment = Net Capital Spending + Change in net working capital (NWC)Net capital spending = ending net fixed assets beginning net fixed assets +depreciationChange in net working capital = ending NWC beginning NWC
6. Find NWC in 2020and 2019in Table 2.
Table 1 Fun Bulb, Co. INCOME STATEMENT Net Sales Cost of Goods sold Depreciation Selling & Administrative Expenses Earnings Before Interest and Taxes 2020 2,050,000 1,537,500 79,000 40,000 393,500 2019 1,678,894 1,343,115 51,000 32,945 251,834 Interest Paid Taxable income Taxes (40%) Net Income Dividends Addition to Retained Earnings 155,000 238,500 95,400 143,100 42,930 100,170 44,000 207,834 83,134 124,700 37,410 87,290 Table 2 BALANCE SHEET 2020 2019 ASSETS Cash Accounts Receivable Inventories Total Current Assets NWC Gross Fixed Assets Accumulated Depreciation Net Fixed Assets 5,000 540,000 1,300,450 1,845,450 950,450 1,300,000 232,000 1,068,000 40,000 200,000 650,000 890,000 535,000 510,000 153,000 357,000 Total Assets 2,913,450 1,247,000 LIABILITIES & EQUITY Accounts Payable Notes Payable Total Current Liabilities 145,000 750,000 895,000 55,000 300,000 355,000 1,226,280 200,000 Long-term Debt Common-stock and Paid in Surplus (200,000 shares outstanding) Retained Earnings Total 600,000 192,170 2,913,450 600,000 92,000 1,247,000 Table 1 Fun Bulb, Co. INCOME STATEMENT Net Sales Cost of Goods sold Depreciation Selling & Administrative Expenses Earnings Before Interest and Taxes 2020 2,050,000 1,537,500 79,000 40,000 393,500 2019 1,678,894 1,343,115 51,000 32,945 251,834 Interest Paid Taxable income Taxes (40%) Net Income Dividends Addition to Retained Earnings 155,000 238,500 95,400 143,100 42,930 100,170 44,000 207,834 83,134 124,700 37,410 87,290 Table 2 BALANCE SHEET 2020 2019 ASSETS Cash Accounts Receivable Inventories Total Current Assets NWC Gross Fixed Assets Accumulated Depreciation Net Fixed Assets 5,000 540,000 1,300,450 1,845,450 950,450 1,300,000 232,000 1,068,000 40,000 200,000 650,000 890,000 535,000 510,000 153,000 357,000 Total Assets 2,913,450 1,247,000 LIABILITIES & EQUITY Accounts Payable Notes Payable Total Current Liabilities 145,000 750,000 895,000 55,000 300,000 355,000 1,226,280 200,000 Long-term Debt Common-stock and Paid in Surplus (200,000 shares outstanding) Retained Earnings Total 600,000 192,170 2,913,450 600,000 92,000 1,247,000
Step by Step Solution
There are 3 Steps involved in it
Step: 1

Get Instant Access to Expert-Tailored Solutions
See step-by-step solutions with expert insights and AI powered tools for academic success
Step: 2

Step: 3

Ace Your Homework with AI
Get the answers you need in no time with our AI-driven, step-by-step assistance
Get Started


