

Question
function y=sysArtCirc(varargin) %sysArtCirc Systemic arterial circulation model % % y=sysArtCirc(x,t,age,htn) models systemic arterial circulation and % returns aortic pressure (y, mmHg) in response to an
function y=sysArtCirc(varargin) %sysArtCirc Systemic arterial circulation model % % y=sysArtCirc(x,t,age,htn) models systemic arterial circulation and % returns aortic pressure (y, mmHg) in response to an input aortic flow % (x, ml/s). Vector x is a user-generated input time series corresponding % to the aortic flow, t is the vector of time samples (in seconds) % corresponding to x, age (20
% Copyright (c) 2018 Arash Mahboobin, PhD, Patrick Loughlin, PhD, and % Sanjeev Shroff, PhD % University of Pittsburgh % BIOENG 1320: Biological Signals and Systems % Fall Term 2018
%validate number of input arguments if strcmp('2016a',version('-release')) narginchk(2,4); else error(nargchk(2,4,nargin)); end %check/populate input arguments [msg,x,t,age,htn]=inputCheck(varargin); %print error messages, if any, to screen error(msg)
%call systemic aortic circulation model (sysArtCircModel) y=sysArtCircModel(x,t,age,htn);
%-------------------- %INTERNAL FUNCTION(S) %-------------------- function [msg,x,t,age,htn]=inputCheck(P) msg=[];%initialize x=P{1};%aortic flow t=P{2};%time samples if (length(P) > 2) && ~isempty(P{3}) age=P{3};%age factor if (age > 80 || age = 20 and 3) && ~isempty(P{4}) htn=P{4};%hypertensive factor if (htn ~= 0 && htn ~= 1) msg='hypertensive factor, htn, must be either 1 or 0'; end else htn=0;%default hypertensive factor end
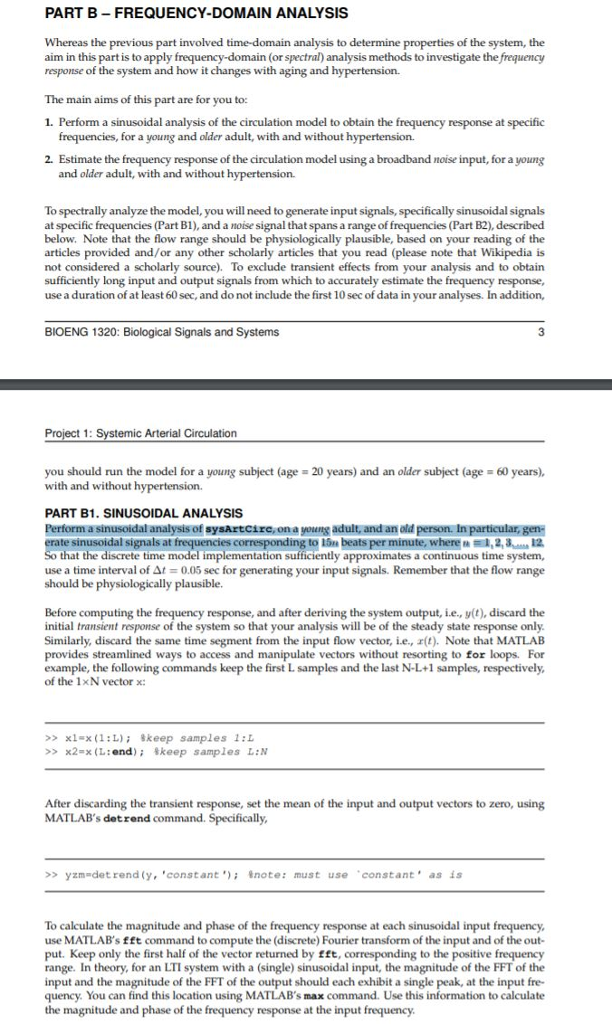
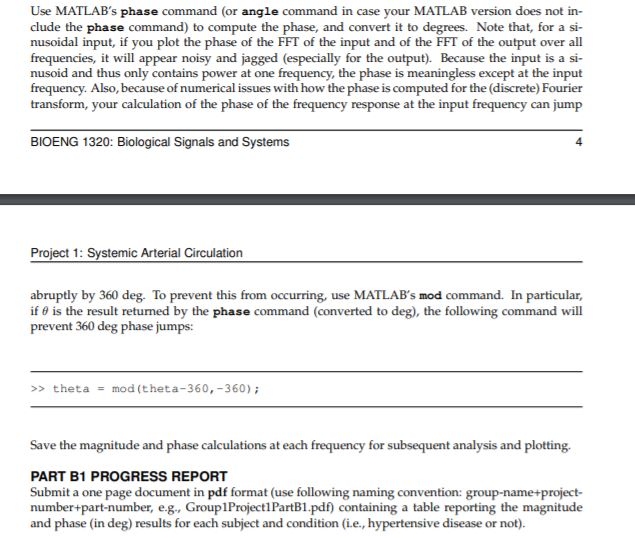
PART B-FREQUENCY-DOMAIN ANALYSIS Whereas the previous part involved time-domain analysis to determine properties of the system, the aim in this part is to apply frequency-domain (or spectral) analysis methods to investigate the frequency response of the system and how it changes with aging and hypertension. The main aims of this part are for you to: 1. Perform a sinusoidal analysis of the circulation model to obtain the frequency response at specific frequencies, for a young and older adult, with and without hypertension. 2. Estimate the frequency response of the circulation model using a broadband noise input, for a young and older adult, with and without hypertension. To spectrally analyze the model, you will need to generate input signals, specifically sinusoidal signals at specific frequencies (Part B1), and a noise signal that spans a range of frequencies (Part B2), described below. Note that the flow range should be physiologically plausible, based on your reading of the articles provided and/or any other scholarly articles that you read (please note that Wikipedia is not considered a scholarly sourc To exclude transient effects from your analysis and to obtain sufficiently long input and output signals from which to accurately estimate the frequency response, use a duration of at least 60 sec, and do not include the first 10 sec of data in your analyses. In addition, BIOENG 1320: Biological Signals and Systems emic Arterial Circulation you should run the model for a young subject (age with and without hypertension. 20 years) and an older subject (age 60 years), PART B1. SINUSOIDAL ANALYSIS Perform a sinusoidal analysis of sysArtcirc, on a young adult, and an old person. In particular, gen- te sinusoidal signals at frequencies corresponding to 15n beats per minute, where,2,3 12 that the discrete time model implementation sufficiently approximates a continuous time system use a time interval of Ar 0.05 sec for generating your input signals. Remember that the flow range should be physiologically plausible Before computing the frequency response, and after deriving the system output, Le.,y(t), discard the initial transient response of the system so that your analysis will be of the steady state response only Similarly, discard the same time segment from the input flow vector, ie.,(t). Note that MATLAB provides streamlined ways to access and manipulate vectors without resorting to for loops. For example, the following commands keep the first L samples and the last N-L+1 samples, respectively of the 1xN vector x: >> >> x13x (1:1); %keep samples 1:1 x2#x (L : end); keep samples L:N After discarding the transient response, set the mean of the input and output vectors to zero, using MATLAB's detrend command. Specifically >yzm-detrend (y, "constant') tnote: must use constant as is To calculate the magnitude and phase of the frequency response at each sinusoidal input frequency use MATLAB's fft command to compute the (discrete) Fourier transform of the input and of the out- put. Keep only the first half of the vector returned by fft, corresponding to the positive frequency range. In theory, for an LTI system with a (single) sinusoidal input, the magnitude of the FFT of the input and the magnitude of the FFT of the output should each exhibit a single peak, at the input fre- quency. You can find this location using MATLAB's max command. Use this information to calculate the magnitude and phase of the frequency response at the input frequency. PART B-FREQUENCY-DOMAIN ANALYSIS Whereas the previous part involved time-domain analysis to determine properties of the system, the aim in this part is to apply frequency-domain (or spectral) analysis methods to investigate the frequency response of the system and how it changes with aging and hypertension. The main aims of this part are for you to: 1. Perform a sinusoidal analysis of the circulation model to obtain the frequency response at specific frequencies, for a young and older adult, with and without hypertension. 2. Estimate the frequency response of the circulation model using a broadband noise input, for a young and older adult, with and without hypertension. To spectrally analyze the model, you will need to generate input signals, specifically sinusoidal signals at specific frequencies (Part B1), and a noise signal that spans a range of frequencies (Part B2), described below. Note that the flow range should be physiologically plausible, based on your reading of the articles provided and/or any other scholarly articles that you read (please note that Wikipedia is not considered a scholarly sourc To exclude transient effects from your analysis and to obtain sufficiently long input and output signals from which to accurately estimate the frequency response, use a duration of at least 60 sec, and do not include the first 10 sec of data in your analyses. In addition, BIOENG 1320: Biological Signals and Systems emic Arterial Circulation you should run the model for a young subject (age with and without hypertension. 20 years) and an older subject (age 60 years), PART B1. SINUSOIDAL ANALYSIS Perform a sinusoidal analysis of sysArtcirc, on a young adult, and an old person. In particular, gen- te sinusoidal signals at frequencies corresponding to 15n beats per minute, where,2,3 12 that the discrete time model implementation sufficiently approximates a continuous time system use a time interval of Ar 0.05 sec for generating your input signals. Remember that the flow range should be physiologically plausible Before computing the frequency response, and after deriving the system output, Le.,y(t), discard the initial transient response of the system so that your analysis will be of the steady state response only Similarly, discard the same time segment from the input flow vector, ie.,(t). Note that MATLAB provides streamlined ways to access and manipulate vectors without resorting to for loops. For example, the following commands keep the first L samples and the last N-L+1 samples, respectively of the 1xN vector x: >> >> x13x (1:1); %keep samples 1:1 x2#x (L : end); keep samples L:N After discarding the transient response, set the mean of the input and output vectors to zero, using MATLAB's detrend command. Specifically >yzm-detrend (y, "constant') tnote: must use constant as is To calculate the magnitude and phase of the frequency response at each sinusoidal input frequency use MATLAB's fft command to compute the (discrete) Fourier transform of the input and of the out- put. Keep only the first half of the vector returned by fft, corresponding to the positive frequency range. In theory, for an LTI system with a (single) sinusoidal input, the magnitude of the FFT of the input and the magnitude of the FFT of the output should each exhibit a single peak, at the input fre- quency. You can find this location using MATLAB's max command. Use this information to calculate the magnitude and phase of the frequency response at the input frequencyStep by Step Solution
There are 3 Steps involved in it
Step: 1

Get Instant Access to Expert-Tailored Solutions
See step-by-step solutions with expert insights and AI powered tools for academic success
Step: 2

Step: 3
Ace Your Homework with AI
Get the answers you need in no time with our AI-driven, step-by-step assistance
Get Started
Parallel Computation Third International Acpc Conference With Special Emphasis On Parallel Databases And Parallel I/O Klagenfurt Austria September 1996 Proceedings Lncs 1127
Authors: Laszlo Boszormenyi
1st Edition
3540616950, 978-3540616955