

Answered step by step
Verified Expert Solution
Question
1 Approved Answer
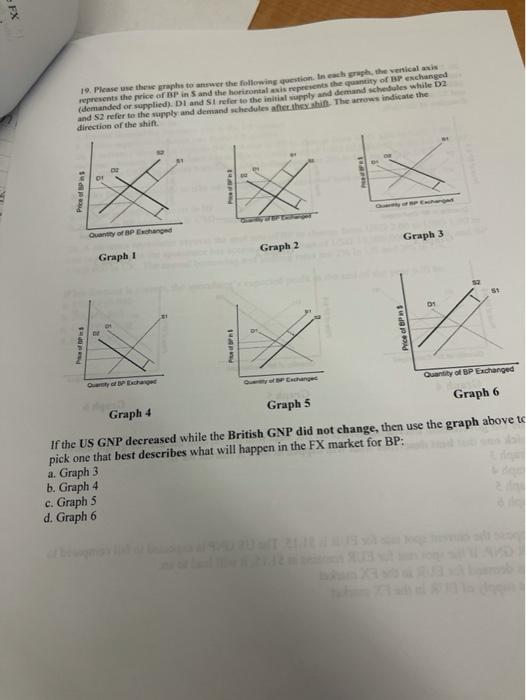
FX 19. Please use these graphs to answer the following question. In each group the venical represents the price of BP in S and the
Step by Step Solution
There are 3 Steps involved in it
Step: 1

Get Instant Access to Expert-Tailored Solutions
See step-by-step solutions with expert insights and AI powered tools for academic success
Step: 2

Step: 3
Ace Your Homework with AI
Get the answers you need in no time with our AI-driven, step-by-step assistance
Get Started
An Introduction to Investment Banks, Hedge Funds, and Private Equity
Authors: David P. Stowell
1st edition
978-0123745033, 0123745039, 978-9380931074