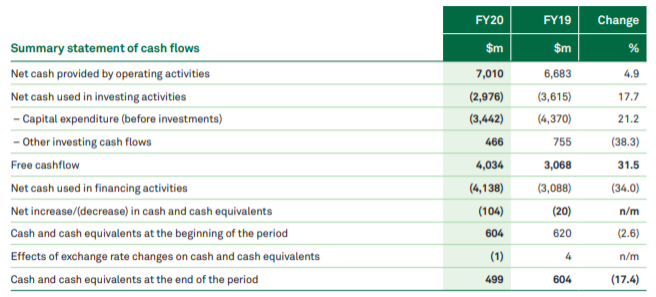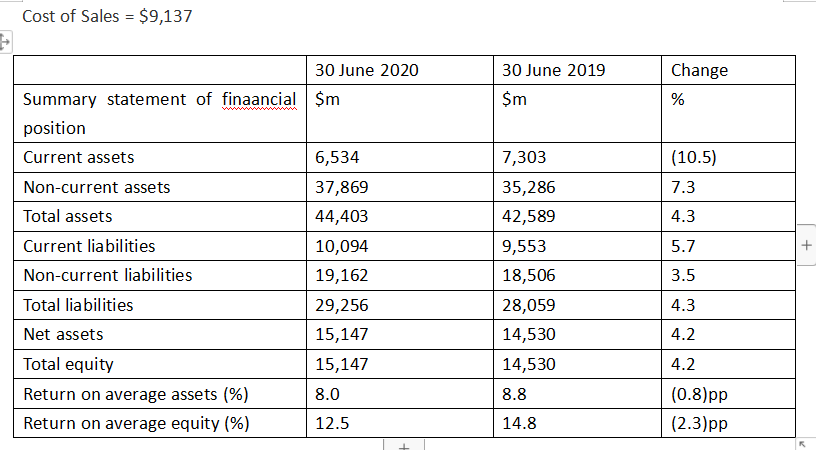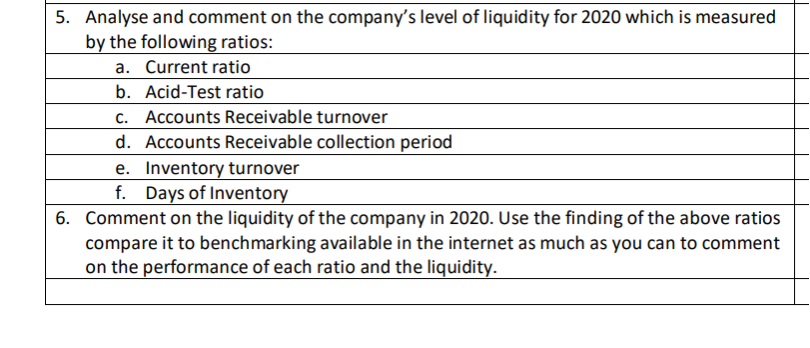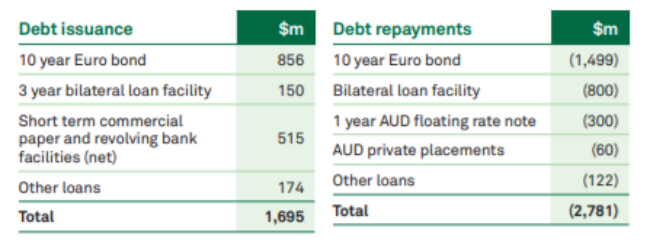


FY20 FY19 Change $m $m 7,010 4.9 6,683 (3,615) (4,370) (2,976) (3,442) 17.7 21.2 466 755 (38.3) Summary statement of cash flows Net cash provided by operating activities Net cash used in investing activities - Capital expenditure (before investments) - Other investing cash flows Free cashflow Net cash used in financing activities Net increase/(decrease) in cash and cash equivalents Cash and cash equivalents at the beginning of the period Effects of exchange rate changes on cash and cash equivalents Cash and cash equivalents at the end of the period 4,034 31.5 3,068 (3,088) (20) (4,138) (104) (34.0) n/m 604 620 (2.6) (1) 4 n/m 499 604 (17.4) C. 5. Analyse and comment on the company's level of liquidity for 2020 which is measured by the following ratios: a. Current ratio b. Acid-Test ratio Accounts Receivable turnover d. Accounts Receivable collection period e. Inventory turnover f. Days of Inventory 6. Comment on the liquidity of the company in 2020. Use the finding of the above ratios compare it to benchmarking available in the internet as much as you can to comment on the performance of each ratio and the liquidity. FY20 FY19 Change $m % $m 25,259 23,710 (6.1) Summary financial results Revenue (excluding finance income) Total income (excluding finance income) Operating expenses Share of net profit/(loss) from equity accounted entities 26,161 27,807 (5.9) 19,835 (14.5) 16,951 (305) 12 n/m EBITDA 8,905 7,984 11.5 Depreciation and amortisation 5,338 4,282 24.7 $m $m 856 150 Debt issuance 10 year Euro bond 3 year bilateral loan facility Short term commercial paper and revolving bank facilities (net) Other loans Total Debt repayments 10 year Euro bond Bilateral loan facility 1 year AUD floating rate note AUD private placements Other loans Total 515 (1,499) (800) (300) (60) (122) (2,781) 174 1,695 5,338 24.7 4,282 3,702 3,567 (3.6) 771 630 22.4 957 923 3.7 Depreciation and amortisation EBIT Net finance costs Income tax expense Profit for the period Profit attributable to equity holders of Telstra Entity Capex Free cashflow 1,839 2,149 (14.4) 1,819 2,154 (15.6) 3,233 4,140 (21.9) 4,034 3,068 31.5 Earnings per share (cents) 15.3 18.1 (15.5) FY20 FY19 Change $m $m 7,010 4.9 6,683 (3,615) (4,370) (2,976) (3,442) 17.7 21.2 466 755 (38.3) Summary statement of cash flows Net cash provided by operating activities Net cash used in investing activities - Capital expenditure (before investments) - Other investing cash flows Free cashflow Net cash used in financing activities Net increase/(decrease) in cash and cash equivalents Cash and cash equivalents at the beginning of the period Effects of exchange rate changes on cash and cash equivalents Cash and cash equivalents at the end of the period 4,034 31.5 3,068 (3,088) (20) (4,138) (104) (34.0) n/m 604 620 (2.6) (1) 4 n/m 499 604 (17.4) C. 5. Analyse and comment on the company's level of liquidity for 2020 which is measured by the following ratios: a. Current ratio b. Acid-Test ratio Accounts Receivable turnover d. Accounts Receivable collection period e. Inventory turnover f. Days of Inventory 6. Comment on the liquidity of the company in 2020. Use the finding of the above ratios compare it to benchmarking available in the internet as much as you can to comment on the performance of each ratio and the liquidity. FY20 FY19 Change $m % $m 25,259 23,710 (6.1) Summary financial results Revenue (excluding finance income) Total income (excluding finance income) Operating expenses Share of net profit/(loss) from equity accounted entities 26,161 27,807 (5.9) 19,835 (14.5) 16,951 (305) 12 n/m EBITDA 8,905 7,984 11.5 Depreciation and amortisation 5,338 4,282 24.7 $m $m 856 150 Debt issuance 10 year Euro bond 3 year bilateral loan facility Short term commercial paper and revolving bank facilities (net) Other loans Total Debt repayments 10 year Euro bond Bilateral loan facility 1 year AUD floating rate note AUD private placements Other loans Total 515 (1,499) (800) (300) (60) (122) (2,781) 174 1,695 5,338 24.7 4,282 3,702 3,567 (3.6) 771 630 22.4 957 923 3.7 Depreciation and amortisation EBIT Net finance costs Income tax expense Profit for the period Profit attributable to equity holders of Telstra Entity Capex Free cashflow 1,839 2,149 (14.4) 1,819 2,154 (15.6) 3,233 4,140 (21.9) 4,034 3,068 31.5 Earnings per share (cents) 15.3 18.1 (15.5)


