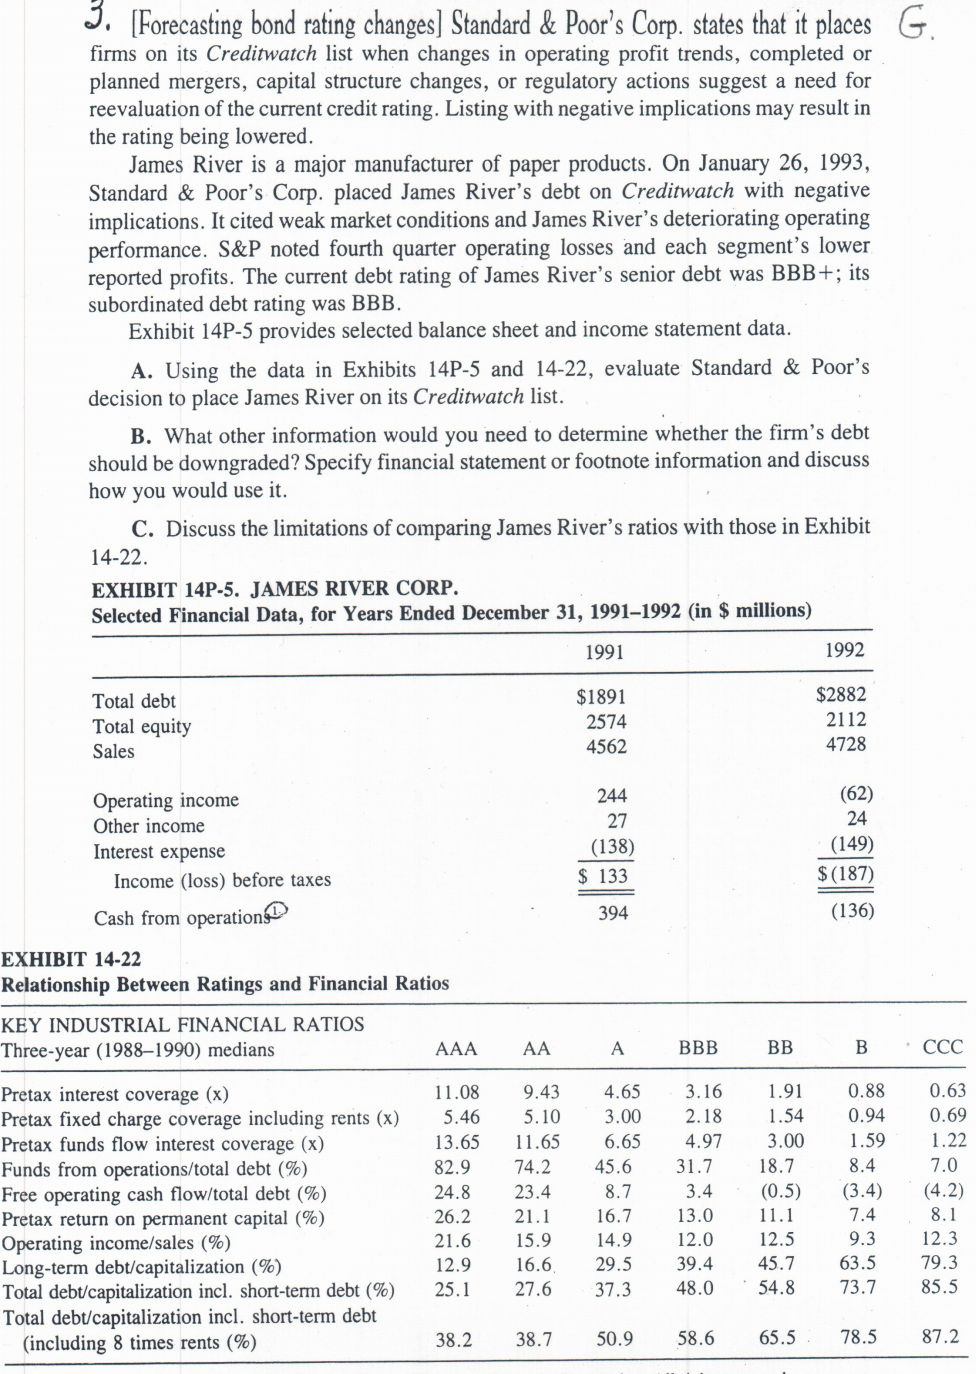
G. 3. [Forecasting bond rating changes] Standard & Poor's Corp. states that it places firms on its Creditwatch list when changes in operating profit trends, completed or planned mergers, capital structure changes, or regulatory actions suggest a need for reevaluation of the current credit rating. Listing with negative implications may result in the rating being lowered. James River is a major manufacturer of paper products. On January 26, 1993, Standard & Poor's Corp. placed James River's debt on Creditwatch with negative implications. It cited weak market conditions and James River's deteriorating operating performance. S&P noted fourth quarter operating losses and each segment's lower reported profits. The current debt rating of James River's senior debt was BBB+; its subordinated debt rating was BBB. Exhibit 14P-5 provides selected balance sheet and income statement data. A. Using the data in Exhibits 14P-5 and 14-22, evaluate Standard & Poor's decision to place James River on its Creditwatch list. B. What other information would you need to determine whether the firm's debt should be downgraded? Specify financial statement or footnote information and discuss how you would use it. C. Discuss the limitations of comparing James River's ratios with those in Exhibit 14-22. Selected Financial Data, for Years Ended December 31, 1991-1992 (in $ millions) 1991 1992 Total debt Total equity Sales $1891 2574 4562 $2882 2112 4728 244 (62) 27 (149) Operating income Other income Interest expense Income (loss) before taxes Cash from operation (138) $ 133 $(187) 394 (136) EXHIBIT 14-22 Relationship Between Ratings and Financial Ratios KEY INDUSTRIAL FINANCIAL RATIOS Three-year (19881990) medians AAA AAA BBB BB B CCC Pretax interest coverage (x) Pretax fixed charge coverage including rents (x) Pretax funds flow interest coverage (x) Funds from operations/total debt (%) Free operating cash flow/total debt (%) Pretax return on permanent capital (%) Operating income/sales (%) Long-term debt/capitalization (%) Total debt/capitalization incl. short-term debt (%) Total debt/capitalization incl. short-term debt (including 8 times rents (%) 11.08 5.46 13.65 82.9 24.8 26.2 21.6 12.9 25.1 9.434.653.16 5.10 3.00 2.18 11.65 6.65 4.97 74.2 45.6 31.7 23.4 - 8.7 3.4 21. 1 1 6.7 13.0 15.9 14.9 12.0 16.6 29.5 39.4 27.6 37.3 48.0 1.91 1.54 3.00 18.7 (0.5) 11.1 12.5 45.7 54.8 0.88 0.94 1.59 8.4 (3.4) 7.4 9.3 63.5 73.7 0.63 0.69 1.22 7.0 (4.2) 8.1 12.3 79.3 85.5 38.2 38.7 50.9 58.6 65.5 78.5 87.2 G. 3. [Forecasting bond rating changes] Standard & Poor's Corp. states that it places firms on its Creditwatch list when changes in operating profit trends, completed or planned mergers, capital structure changes, or regulatory actions suggest a need for reevaluation of the current credit rating. Listing with negative implications may result in the rating being lowered. James River is a major manufacturer of paper products. On January 26, 1993, Standard & Poor's Corp. placed James River's debt on Creditwatch with negative implications. It cited weak market conditions and James River's deteriorating operating performance. S&P noted fourth quarter operating losses and each segment's lower reported profits. The current debt rating of James River's senior debt was BBB+; its subordinated debt rating was BBB. Exhibit 14P-5 provides selected balance sheet and income statement data. A. Using the data in Exhibits 14P-5 and 14-22, evaluate Standard & Poor's decision to place James River on its Creditwatch list. B. What other information would you need to determine whether the firm's debt should be downgraded? Specify financial statement or footnote information and discuss how you would use it. C. Discuss the limitations of comparing James River's ratios with those in Exhibit 14-22. Selected Financial Data, for Years Ended December 31, 1991-1992 (in $ millions) 1991 1992 Total debt Total equity Sales $1891 2574 4562 $2882 2112 4728 244 (62) 27 (149) Operating income Other income Interest expense Income (loss) before taxes Cash from operation (138) $ 133 $(187) 394 (136) EXHIBIT 14-22 Relationship Between Ratings and Financial Ratios KEY INDUSTRIAL FINANCIAL RATIOS Three-year (19881990) medians AAA AAA BBB BB B CCC Pretax interest coverage (x) Pretax fixed charge coverage including rents (x) Pretax funds flow interest coverage (x) Funds from operations/total debt (%) Free operating cash flow/total debt (%) Pretax return on permanent capital (%) Operating income/sales (%) Long-term debt/capitalization (%) Total debt/capitalization incl. short-term debt (%) Total debt/capitalization incl. short-term debt (including 8 times rents (%) 11.08 5.46 13.65 82.9 24.8 26.2 21.6 12.9 25.1 9.434.653.16 5.10 3.00 2.18 11.65 6.65 4.97 74.2 45.6 31.7 23.4 - 8.7 3.4 21. 1 1 6.7 13.0 15.9 14.9 12.0 16.6 29.5 39.4 27.6 37.3 48.0 1.91 1.54 3.00 18.7 (0.5) 11.1 12.5 45.7 54.8 0.88 0.94 1.59 8.4 (3.4) 7.4 9.3 63.5 73.7 0.63 0.69 1.22 7.0 (4.2) 8.1 12.3 79.3 85.5 38.2 38.7 50.9 58.6 65.5 78.5 87.2