

Question
g. Based on your regression results, what is the relationship between the market return and your stock's return? (The slope coefficient represents the estimate of
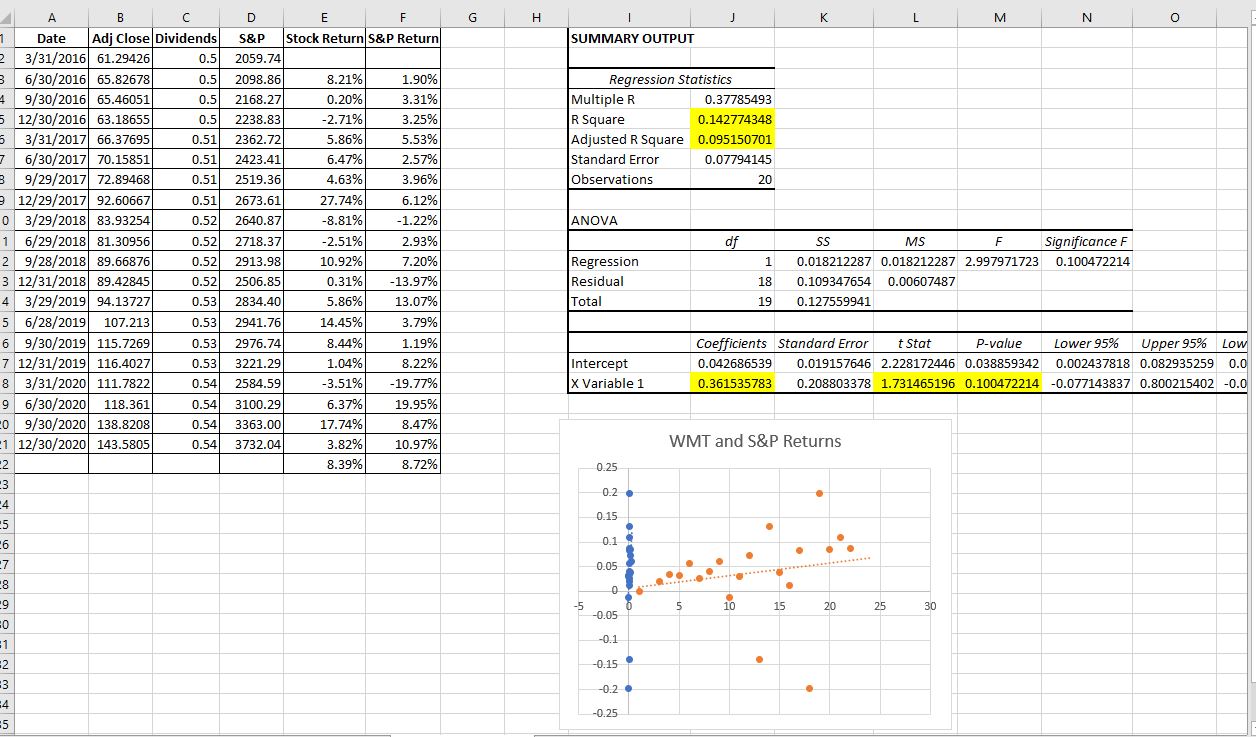
g. Based on your regression results, what is the relationship between the market return and your stock's return? (The slope coefficient represents the estimate of your firm's beta, which is a measure of its systematic risk.)
h. Based on your regression results, does it appear that there is a significant relationship between the market return and your stock's return? (The t-statistic or p-value for the slope coefficient can be used to determine whether there is a significant relationship.)
i. Based on your regression results, what proportion of the variation in the stock's returns can be explained by movements (returns) in the stock market overall? (The R-SQUARED statistic measures the proportion of variation in the dependent variable that is explained by the independent variable in a regression model like the one described previously.) Does it appear that the stock's return is driven mainly by stock market movements or by other factors that are not captured in the regression model?
j. What is the standard deviation of your stock's quarterly returns over the 20-quarter period? (You can easily compute the standard deviation of your column of stock return data by using a "compute" statement.) What is the standard deviation of the quarterly stock market returns (as measured by quarterly returns on the S&P 500 index) over the 20-quarter period? Is your stock more volatile than the stock market in general? If so, why do you think it is more volatile than the market?
k. Assume that the average risk-free rate is 4.13%. Determine the Sharpe index for your stock. (The Sharpe index is equal to your stock's average quarterly return, minus the average risk-free rate, divided by the standard deviation of your stock's returns.) Determine the Treynor index for your stock. (The Treynor index is equal to your stock's average quarterly return, minus the average risk-free rate, divided by the estimated beta of your stock.) Interpret both indices.
Step by Step Solution
There are 3 Steps involved in it
Step: 1

Get Instant Access to Expert-Tailored Solutions
See step-by-step solutions with expert insights and AI powered tools for academic success
Step: 2

Step: 3
Ace Your Homework with AI
Get the answers you need in no time with our AI-driven, step-by-step assistance
Get Started
Precalculus Enhanced With Graphing Utilities (Subscription)
Authors: Michael, Michael Sullivan III, Michael III Sullivan, III Sullivan
6th Edition
0321849108, 9780321849106