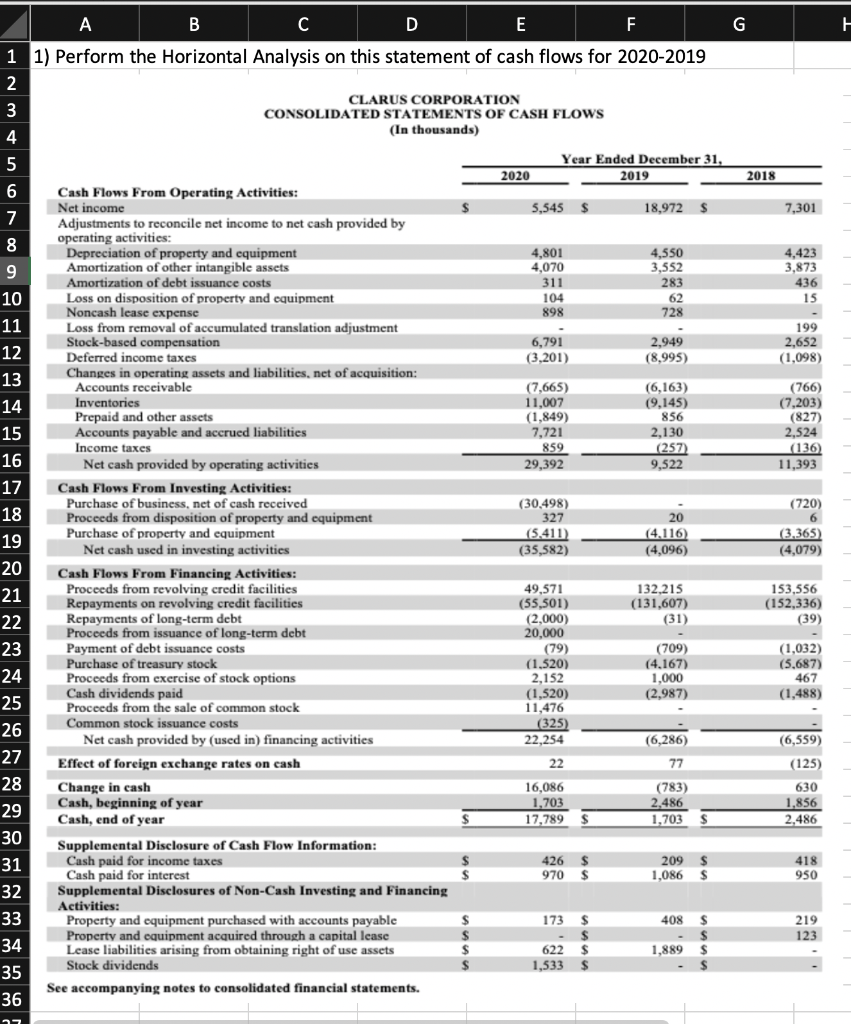
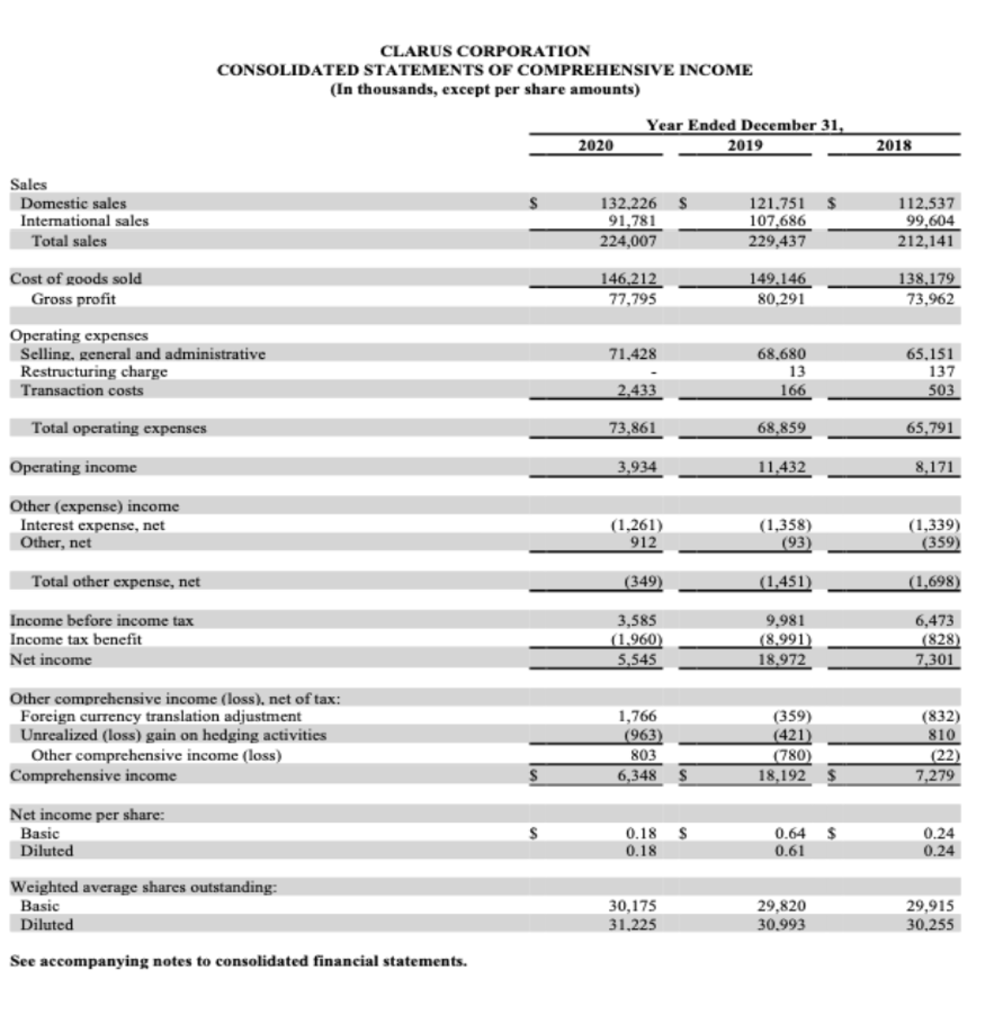
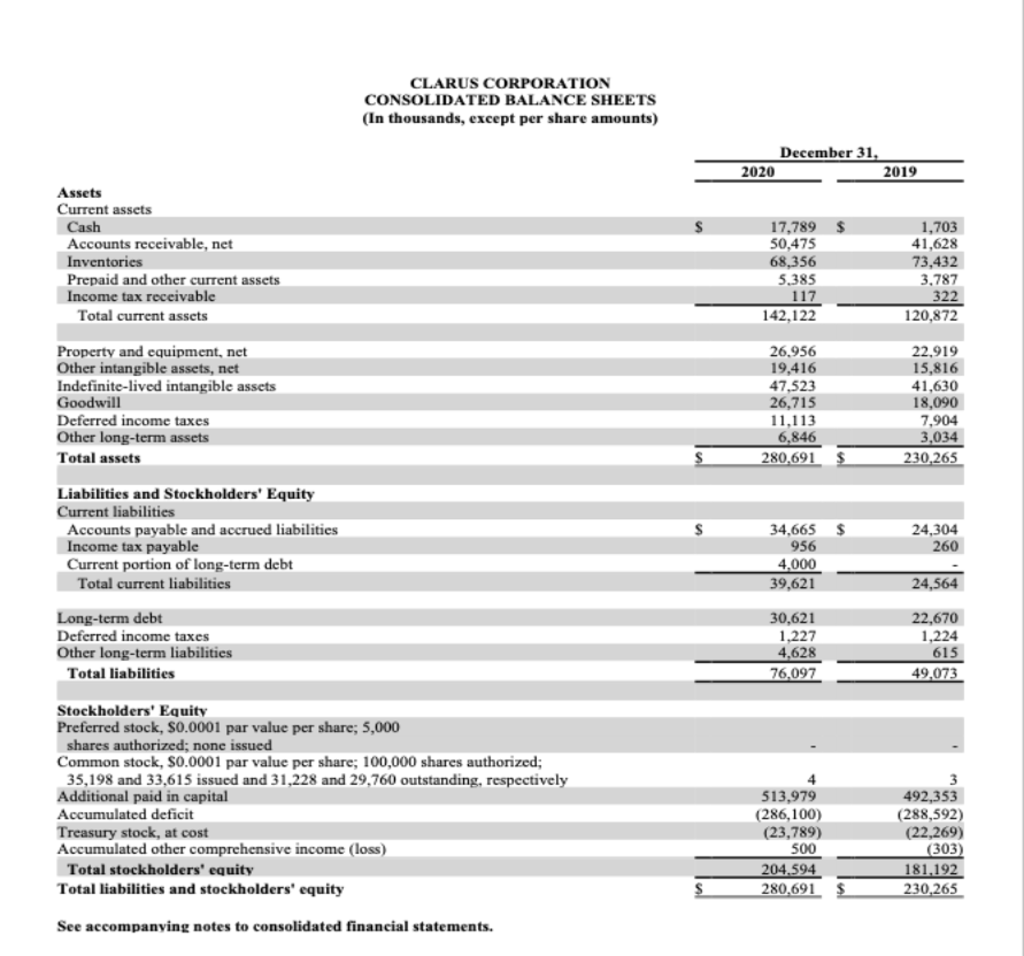
G E 2018 7,301 4,423 3,873 436 15 199 2,652 (1,098) (766) (7,203) (827) 2,524 (136 11,393 B D E F 1 1) Perform the Horizontal Analysis on this statement of cash flows for 2020-2019 2 CLARUS CORPORATION 3 CONSOLIDATED STATEMENTS OF CASH FLOWS 4 (In thousands) 5 Year Ended December 31, 2020 2019 6 Cash Flows From Operating Activities: Net income 5,545 $ 18,972 s 7 Adjustments to reconcile net income to net cash provided by 8 operating activities: Depreciation of property and equipment 4,801 4,550 9 Amortization of other intangible assets 4,070 3,552 Amortization of debt issuance costs 311 283 10 Loss on disposition of property and equipment 104 62 Noncash lease expense 898 728 11 Loss from removal of accumulated translation adjustment Stock-based compensation 6,791 2,949 12 Deferred income taxes (3,201) (8,995) 13 Changes in operating assets and liabilities, net of acquisition: Accounts receivable (7,665) (6,163) 14 Inventories 11,007 (9.145) Prepaid and other assets (1,849) 856 15 Accounts payable and accrued liabilities 7,721 2,130 Income taxes 859 (257) 16 Net cash provided by operating activities 29,392 9,522 17 Cash Flows From Investing Activities: Purchase of business, net of cash received (30.498) 18 Proceeds from disposition of property and equipment 327 20 Purchase of property and equipment 19 (5.411) (4.116 Net cash used in investing activities (35,582) (4,096) 20 Cash Flows From Financing Activities: 21 Proceeds from revolving credit facilities 49.571 132.215 Repayments on revolving credit facilities (55,501) (131,607) 22 Repayments of long-term debt (2.000) (31) Proceeds from issuance of long-term debt 20,000 23 Payment of debt issuance costs (79) (709) Purchase of treasury stock (1,520) (4.167) 24 Proceeds from exercise of stock options 2,152 1,000 Cash dividends paid 25 (1,520) (2,987) Proceeds from the sale of common stock 11,476 26 Common stock issuance costs (325) Net cash provided by (used in) financing activities 22,254 (6,286) 27 Effect of foreign exchange rates on cash 22 77 28 Change in cash 16,086 (783) 29 Cash, beginning of year 1.703 2.486 Cash, end of year 17,789 1,703 30 Supplemental Disclosure of Cash Flow Information: 31 Cash paid for income taxes 426 $ 209 $ Cash paid for interest 970 $ 1,086 $ 32 Supplemental Disclosures of Non-Cash Investing and Financing Activities: 33 Property and equipment purchased with accounts payable $ 173 $ 408 Property and equipment acquired through a capital lease S 34 Lease liabilities arising from obtaining right of use assets $ 622 s 1,889 Stock dividends S 35 1,533 See accompanying notes to consolidated financial statements. 36 (720) 6 (3.365) (4,079) 153,556 (152,336) (39) (1,032) (5.687) 467 (1,488) (6,559) (125 630 1,856 2,486 418 950 s S 219 123 S S CLARUS CORPORATION CONSOLIDATED STATEMENTS OF COMPREHENSIVE INCOME (In thousands, except per share amounts) Year Ended December 31, 2019 2020 2018 s $ Sales Domestic sales International sales Total sales 132.226 91,781 224,007 121.751 107,686 229,437 112.537 99,604 212,141 Cost of goods sold Gross profit 146,212 77,795 149.146 80.291 138,179 73,962 71,428 Operating expenses Selling, general and administrative Restructuring charge Transaction costs 68.680 13 166 65.151 137 503 2.433 Total operating expenses 73.861 68,859 65,791 Operating income 3,934 11,432 8,171 Other (expense) income Interest expense, net Other, net (1,261) 912 (1,358) (93 (1,339) (359) Total other expense, net (349) (1,451 (1,698) Income before income tax Income tax benefit Net income 3,585 (1.960) 9,981 (8.991) 6,473 (828) 7,301 5,545 18.972 Other comprehensive income (loss), net of tax: Foreign currency translation adjustment Unrealized (loss) gain on hedging activities Other comprehensive income (loss) Comprehensive income 1,766 (963) 803 6,348 (359) (421 (780) 18,192 (832) 810 (22) 7,279 S Net income per share: Basic Diluted S $ 0.18 0.18 0.64 0.61 0.24 0.24 Weighted average shares outstanding: Basic Diluted 30,175 31,225 29,820 30.993 29,915 30.255 See accompanying notes to consolidated financial statements. CLARUS CORPORATION CONSOLIDATED BALANCE SHEETS (In thousands, except per share amounts) December 31, 2020 2019 $ Assets Current assets Cash Accounts receivable, net Inventories Prepaid and other current assets Income tax receivable Total current assets 17,789 50,475 68,356 5.385 117 142,122 1,703 41,628 73,432 3,787 322 120,872 Property and equipment, net Other intangible assets, net Indefinite-lived intangible assets Goodwill Deferred income taxes Other long-term assets Total assets 26.956 19,416 47,523 26,715 11.113 6,846 280.691 22,919 15,816 41,630 18,090 7,904 3,034 230,265 S $ Liabilities and Stockholders' Equity Current liabilities Accounts payable and accrued liabilities Income tax payable Current portion of long-term debt Total current liabilities 24,304 260 34,665 956 4,000 39,621 24,564 Long-term debt Deferred income taxes Other long-term liabilities Total liabilities 30,621 1,227 4,628 76,097 22,670 1,224 615 49,073 Stockholders' Equity Preferred stock, S0.0001 par value per share; 5,000 shares authorized; none issued Common stock, S0.0001 par value per share; 100,000 shares authorized; 35,198 and 33,615 issued and 31,228 and 29,760 outstanding, respectively Additional paid in capital Accumulated deficit Treasury stock, at cost Accumulated other comprehensive income (loss) Total stockholders' equity Total liabilities and stockholders' equity 4 513,979 (286,100) (23,789) 500 204,594 280.691 $ 492,353 (288,592) (22,269) (303) 181,192 230.265 See accompanying notes to consolidated financial statements. G E 2018 7,301 4,423 3,873 436 15 199 2,652 (1,098) (766) (7,203) (827) 2,524 (136 11,393 B D E F 1 1) Perform the Horizontal Analysis on this statement of cash flows for 2020-2019 2 CLARUS CORPORATION 3 CONSOLIDATED STATEMENTS OF CASH FLOWS 4 (In thousands) 5 Year Ended December 31, 2020 2019 6 Cash Flows From Operating Activities: Net income 5,545 $ 18,972 s 7 Adjustments to reconcile net income to net cash provided by 8 operating activities: Depreciation of property and equipment 4,801 4,550 9 Amortization of other intangible assets 4,070 3,552 Amortization of debt issuance costs 311 283 10 Loss on disposition of property and equipment 104 62 Noncash lease expense 898 728 11 Loss from removal of accumulated translation adjustment Stock-based compensation 6,791 2,949 12 Deferred income taxes (3,201) (8,995) 13 Changes in operating assets and liabilities, net of acquisition: Accounts receivable (7,665) (6,163) 14 Inventories 11,007 (9.145) Prepaid and other assets (1,849) 856 15 Accounts payable and accrued liabilities 7,721 2,130 Income taxes 859 (257) 16 Net cash provided by operating activities 29,392 9,522 17 Cash Flows From Investing Activities: Purchase of business, net of cash received (30.498) 18 Proceeds from disposition of property and equipment 327 20 Purchase of property and equipment 19 (5.411) (4.116 Net cash used in investing activities (35,582) (4,096) 20 Cash Flows From Financing Activities: 21 Proceeds from revolving credit facilities 49.571 132.215 Repayments on revolving credit facilities (55,501) (131,607) 22 Repayments of long-term debt (2.000) (31) Proceeds from issuance of long-term debt 20,000 23 Payment of debt issuance costs (79) (709) Purchase of treasury stock (1,520) (4.167) 24 Proceeds from exercise of stock options 2,152 1,000 Cash dividends paid 25 (1,520) (2,987) Proceeds from the sale of common stock 11,476 26 Common stock issuance costs (325) Net cash provided by (used in) financing activities 22,254 (6,286) 27 Effect of foreign exchange rates on cash 22 77 28 Change in cash 16,086 (783) 29 Cash, beginning of year 1.703 2.486 Cash, end of year 17,789 1,703 30 Supplemental Disclosure of Cash Flow Information: 31 Cash paid for income taxes 426 $ 209 $ Cash paid for interest 970 $ 1,086 $ 32 Supplemental Disclosures of Non-Cash Investing and Financing Activities: 33 Property and equipment purchased with accounts payable $ 173 $ 408 Property and equipment acquired through a capital lease S 34 Lease liabilities arising from obtaining right of use assets $ 622 s 1,889 Stock dividends S 35 1,533 See accompanying notes to consolidated financial statements. 36 (720) 6 (3.365) (4,079) 153,556 (152,336) (39) (1,032) (5.687) 467 (1,488) (6,559) (125 630 1,856 2,486 418 950 s S 219 123 S S CLARUS CORPORATION CONSOLIDATED STATEMENTS OF COMPREHENSIVE INCOME (In thousands, except per share amounts) Year Ended December 31, 2019 2020 2018 s $ Sales Domestic sales International sales Total sales 132.226 91,781 224,007 121.751 107,686 229,437 112.537 99,604 212,141 Cost of goods sold Gross profit 146,212 77,795 149.146 80.291 138,179 73,962 71,428 Operating expenses Selling, general and administrative Restructuring charge Transaction costs 68.680 13 166 65.151 137 503 2.433 Total operating expenses 73.861 68,859 65,791 Operating income 3,934 11,432 8,171 Other (expense) income Interest expense, net Other, net (1,261) 912 (1,358) (93 (1,339) (359) Total other expense, net (349) (1,451 (1,698) Income before income tax Income tax benefit Net income 3,585 (1.960) 9,981 (8.991) 6,473 (828) 7,301 5,545 18.972 Other comprehensive income (loss), net of tax: Foreign currency translation adjustment Unrealized (loss) gain on hedging activities Other comprehensive income (loss) Comprehensive income 1,766 (963) 803 6,348 (359) (421 (780) 18,192 (832) 810 (22) 7,279 S Net income per share: Basic Diluted S $ 0.18 0.18 0.64 0.61 0.24 0.24 Weighted average shares outstanding: Basic Diluted 30,175 31,225 29,820 30.993 29,915 30.255 See accompanying notes to consolidated financial statements. CLARUS CORPORATION CONSOLIDATED BALANCE SHEETS (In thousands, except per share amounts) December 31, 2020 2019 $ Assets Current assets Cash Accounts receivable, net Inventories Prepaid and other current assets Income tax receivable Total current assets 17,789 50,475 68,356 5.385 117 142,122 1,703 41,628 73,432 3,787 322 120,872 Property and equipment, net Other intangible assets, net Indefinite-lived intangible assets Goodwill Deferred income taxes Other long-term assets Total assets 26.956 19,416 47,523 26,715 11.113 6,846 280.691 22,919 15,816 41,630 18,090 7,904 3,034 230,265 S $ Liabilities and Stockholders' Equity Current liabilities Accounts payable and accrued liabilities Income tax payable Current portion of long-term debt Total current liabilities 24,304 260 34,665 956 4,000 39,621 24,564 Long-term debt Deferred income taxes Other long-term liabilities Total liabilities 30,621 1,227 4,628 76,097 22,670 1,224 615 49,073 Stockholders' Equity Preferred stock, S0.0001 par value per share; 5,000 shares authorized; none issued Common stock, S0.0001 par value per share; 100,000 shares authorized; 35,198 and 33,615 issued and 31,228 and 29,760 outstanding, respectively Additional paid in capital Accumulated deficit Treasury stock, at cost Accumulated other comprehensive income (loss) Total stockholders' equity Total liabilities and stockholders' equity 4 513,979 (286,100) (23,789) 500 204,594 280.691 $ 492,353 (288,592) (22,269) (303) 181,192 230.265 See accompanying notes to consolidated financial statements