Answered step by step
Verified Expert Solution
Link Copied!

Question

1 Approved Answer

g. Make three statements about the data from the cumulative relative frequency table or the plots. 8) The second sheet on QMB3200-Homework#1Data.xlsx is named BetaEmployees.
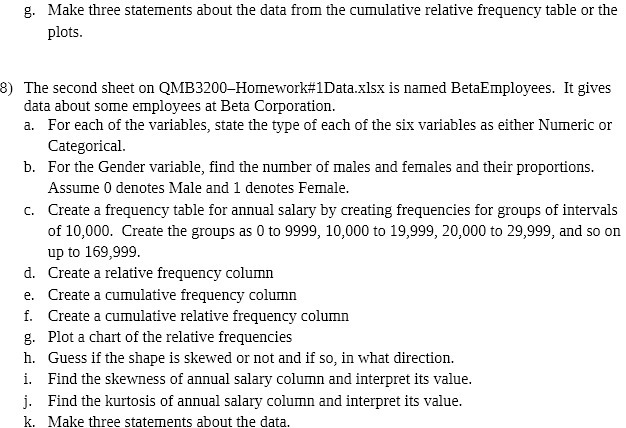
image text in transcribed
g. Make three statements about the data from the cumulative relative frequency table or the plots. 8) The second sheet on QMB3200-Homework#1Data.xlsx is named BetaEmployees. It gives data about some employees at Beta Corporation. a. For each of the variables, state the type of each of the six variables as either Numeric or Categorical. b. For the Gender variable, find the number of males and females and their proportions. Assume 0 denotes Male and 1 denotes Female. c. Create a frequency table for annual salary by creating frequencies for groups of intervals of 10,000. Create the groups as 0 to 9999, 10,000 to 19,999, 20,000 to 29,999, and so on up to 169,999. d. Create a relative frequency column e. Create a cumulative frequency column f. Create a cumulative relative frequency column g. Plot a chart of the relative frequencies h. Guess if the shape is skewed or not and if so, in what direction. i. Find the skewness of annual salary column and interpret its value. j. Find the kurtosis of annual salary column and interpret its value. k. Make three statements about the data

Step by Step Solution

There are 3 Steps involved in it

Step: 1

blur-text-image

Get Instant Access to Expert-Tailored Solutions

See step-by-step solutions with expert insights and AI powered tools for academic success

Step: 2

blur-text-image

Step: 3

blur-text-image

Ace Your Homework with AI

Get the answers you need in no time with our AI-driven, step-by-step assistance

Get Started

Recommended Textbook for

Algebra And Trigonometry

Authors: Cynthia Y Young

5th Edition

1119820898, 9781119820895

More Books

Students also viewed these Mathematics questions