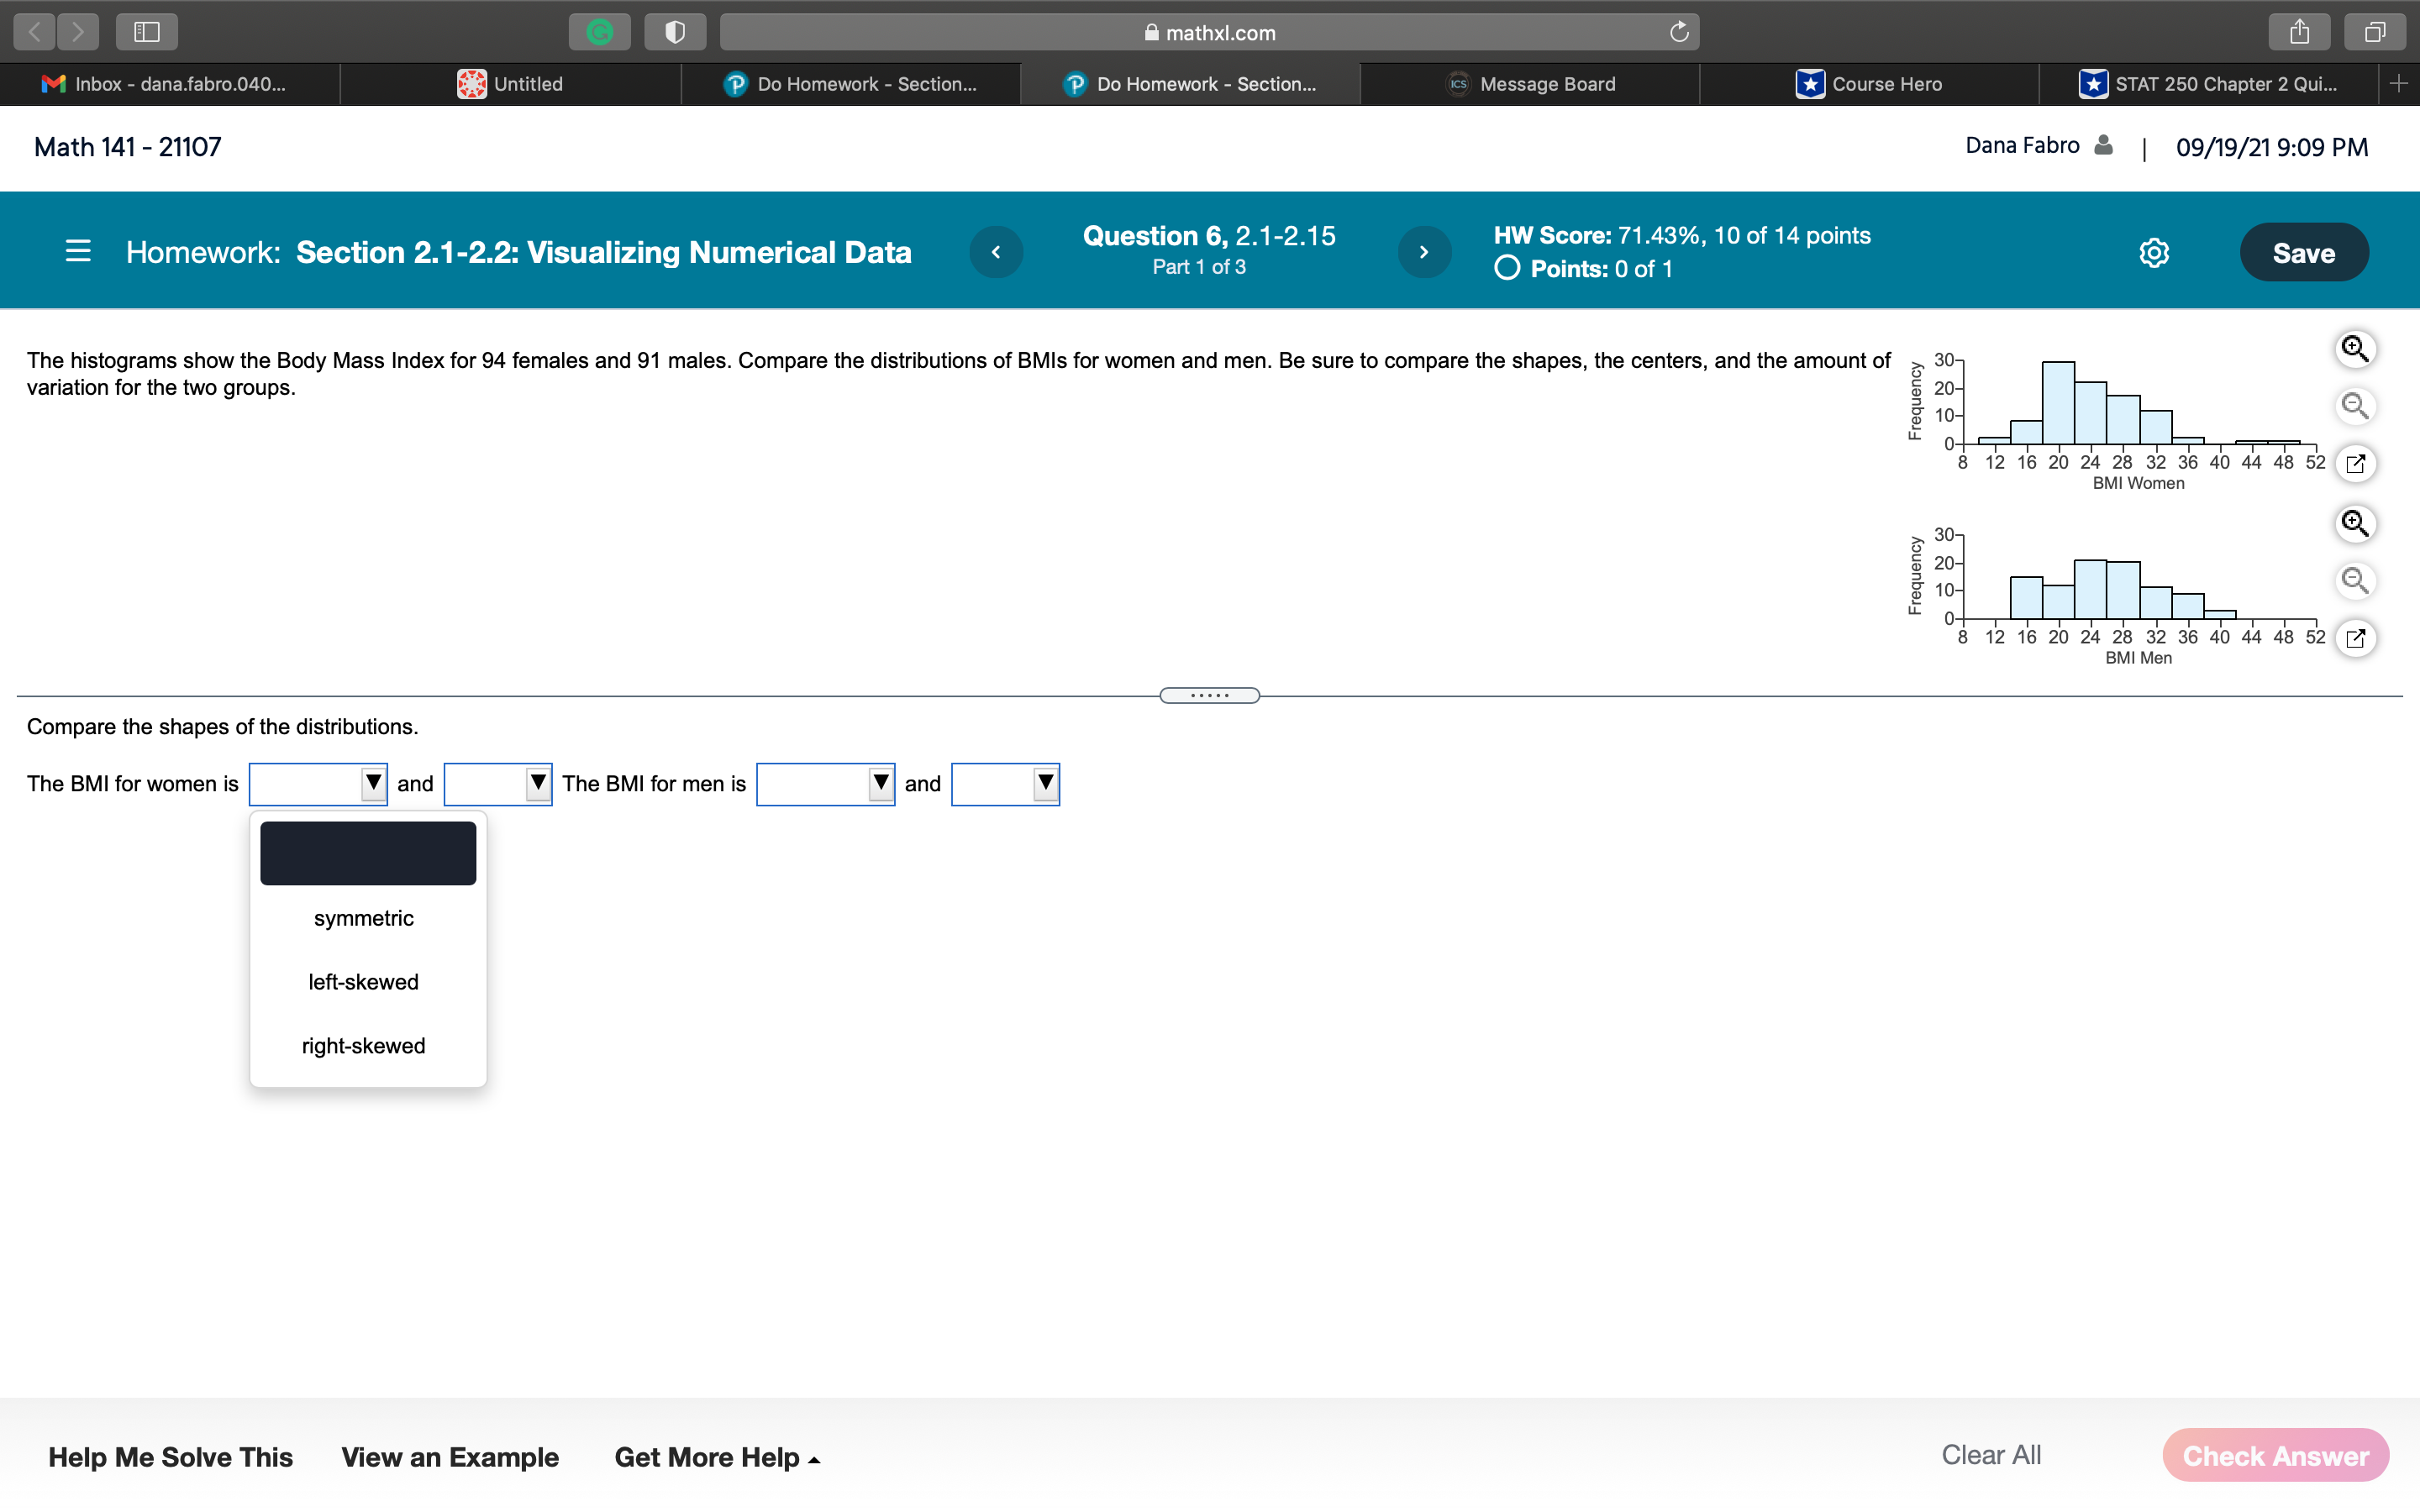
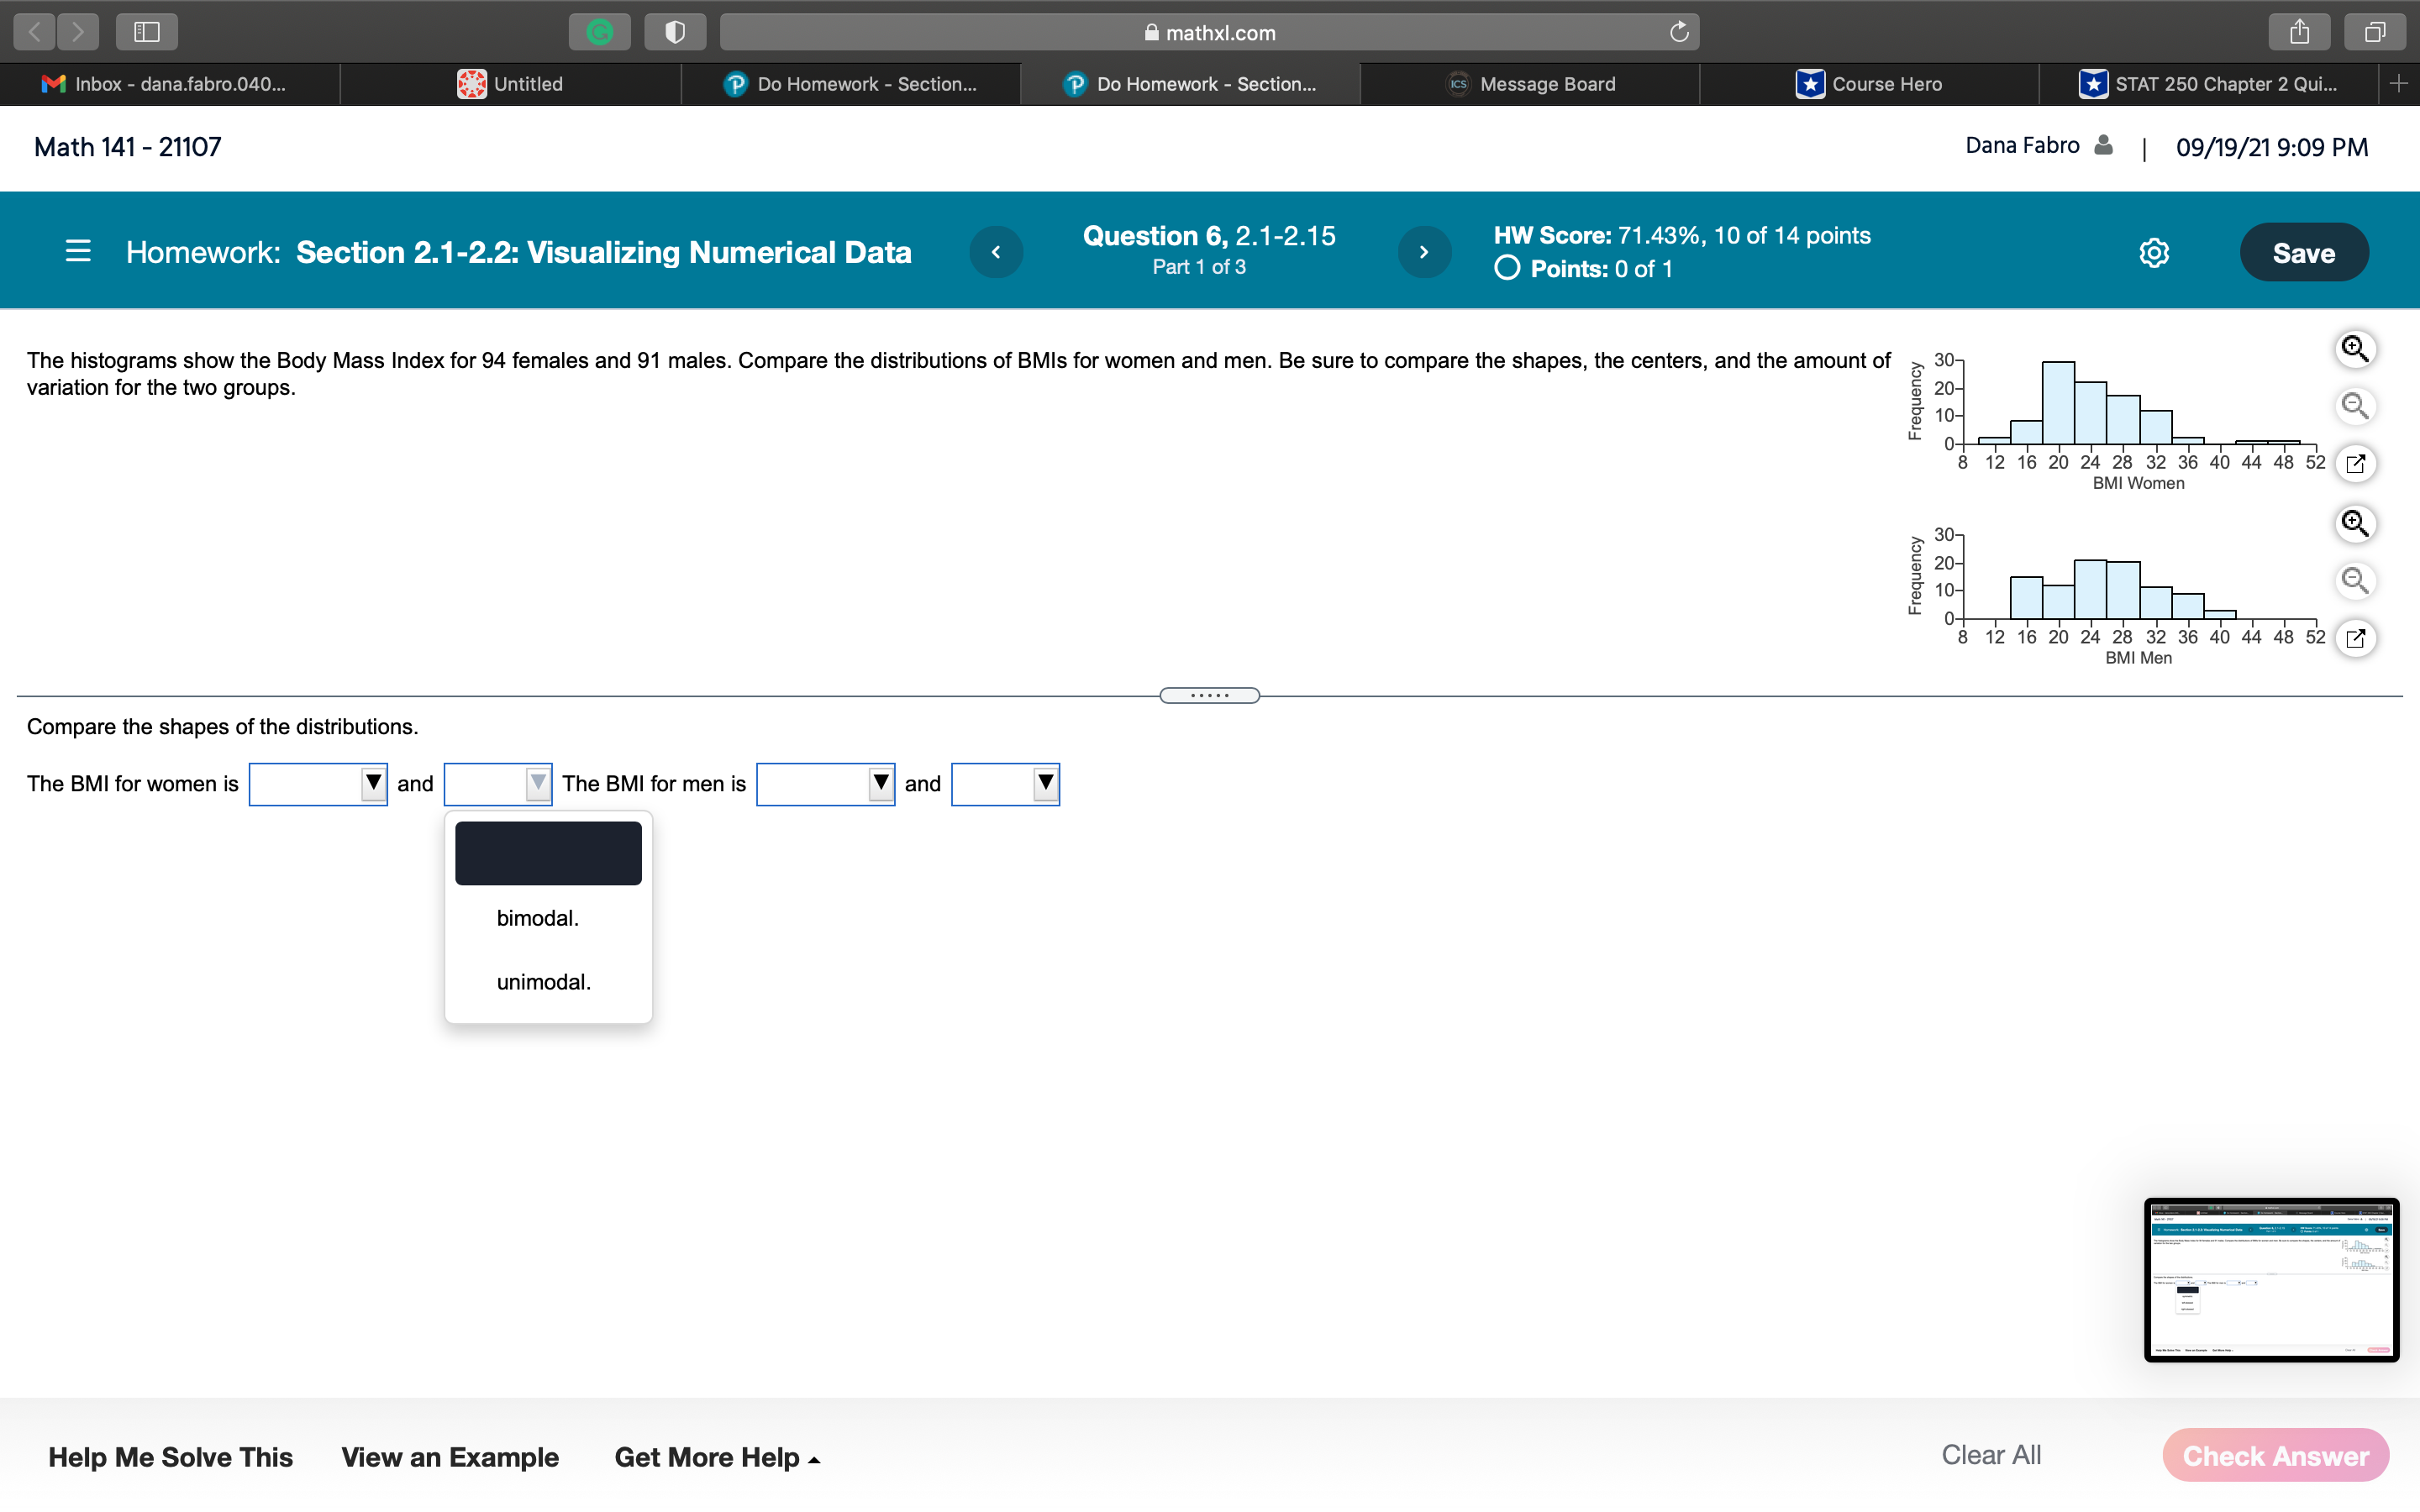
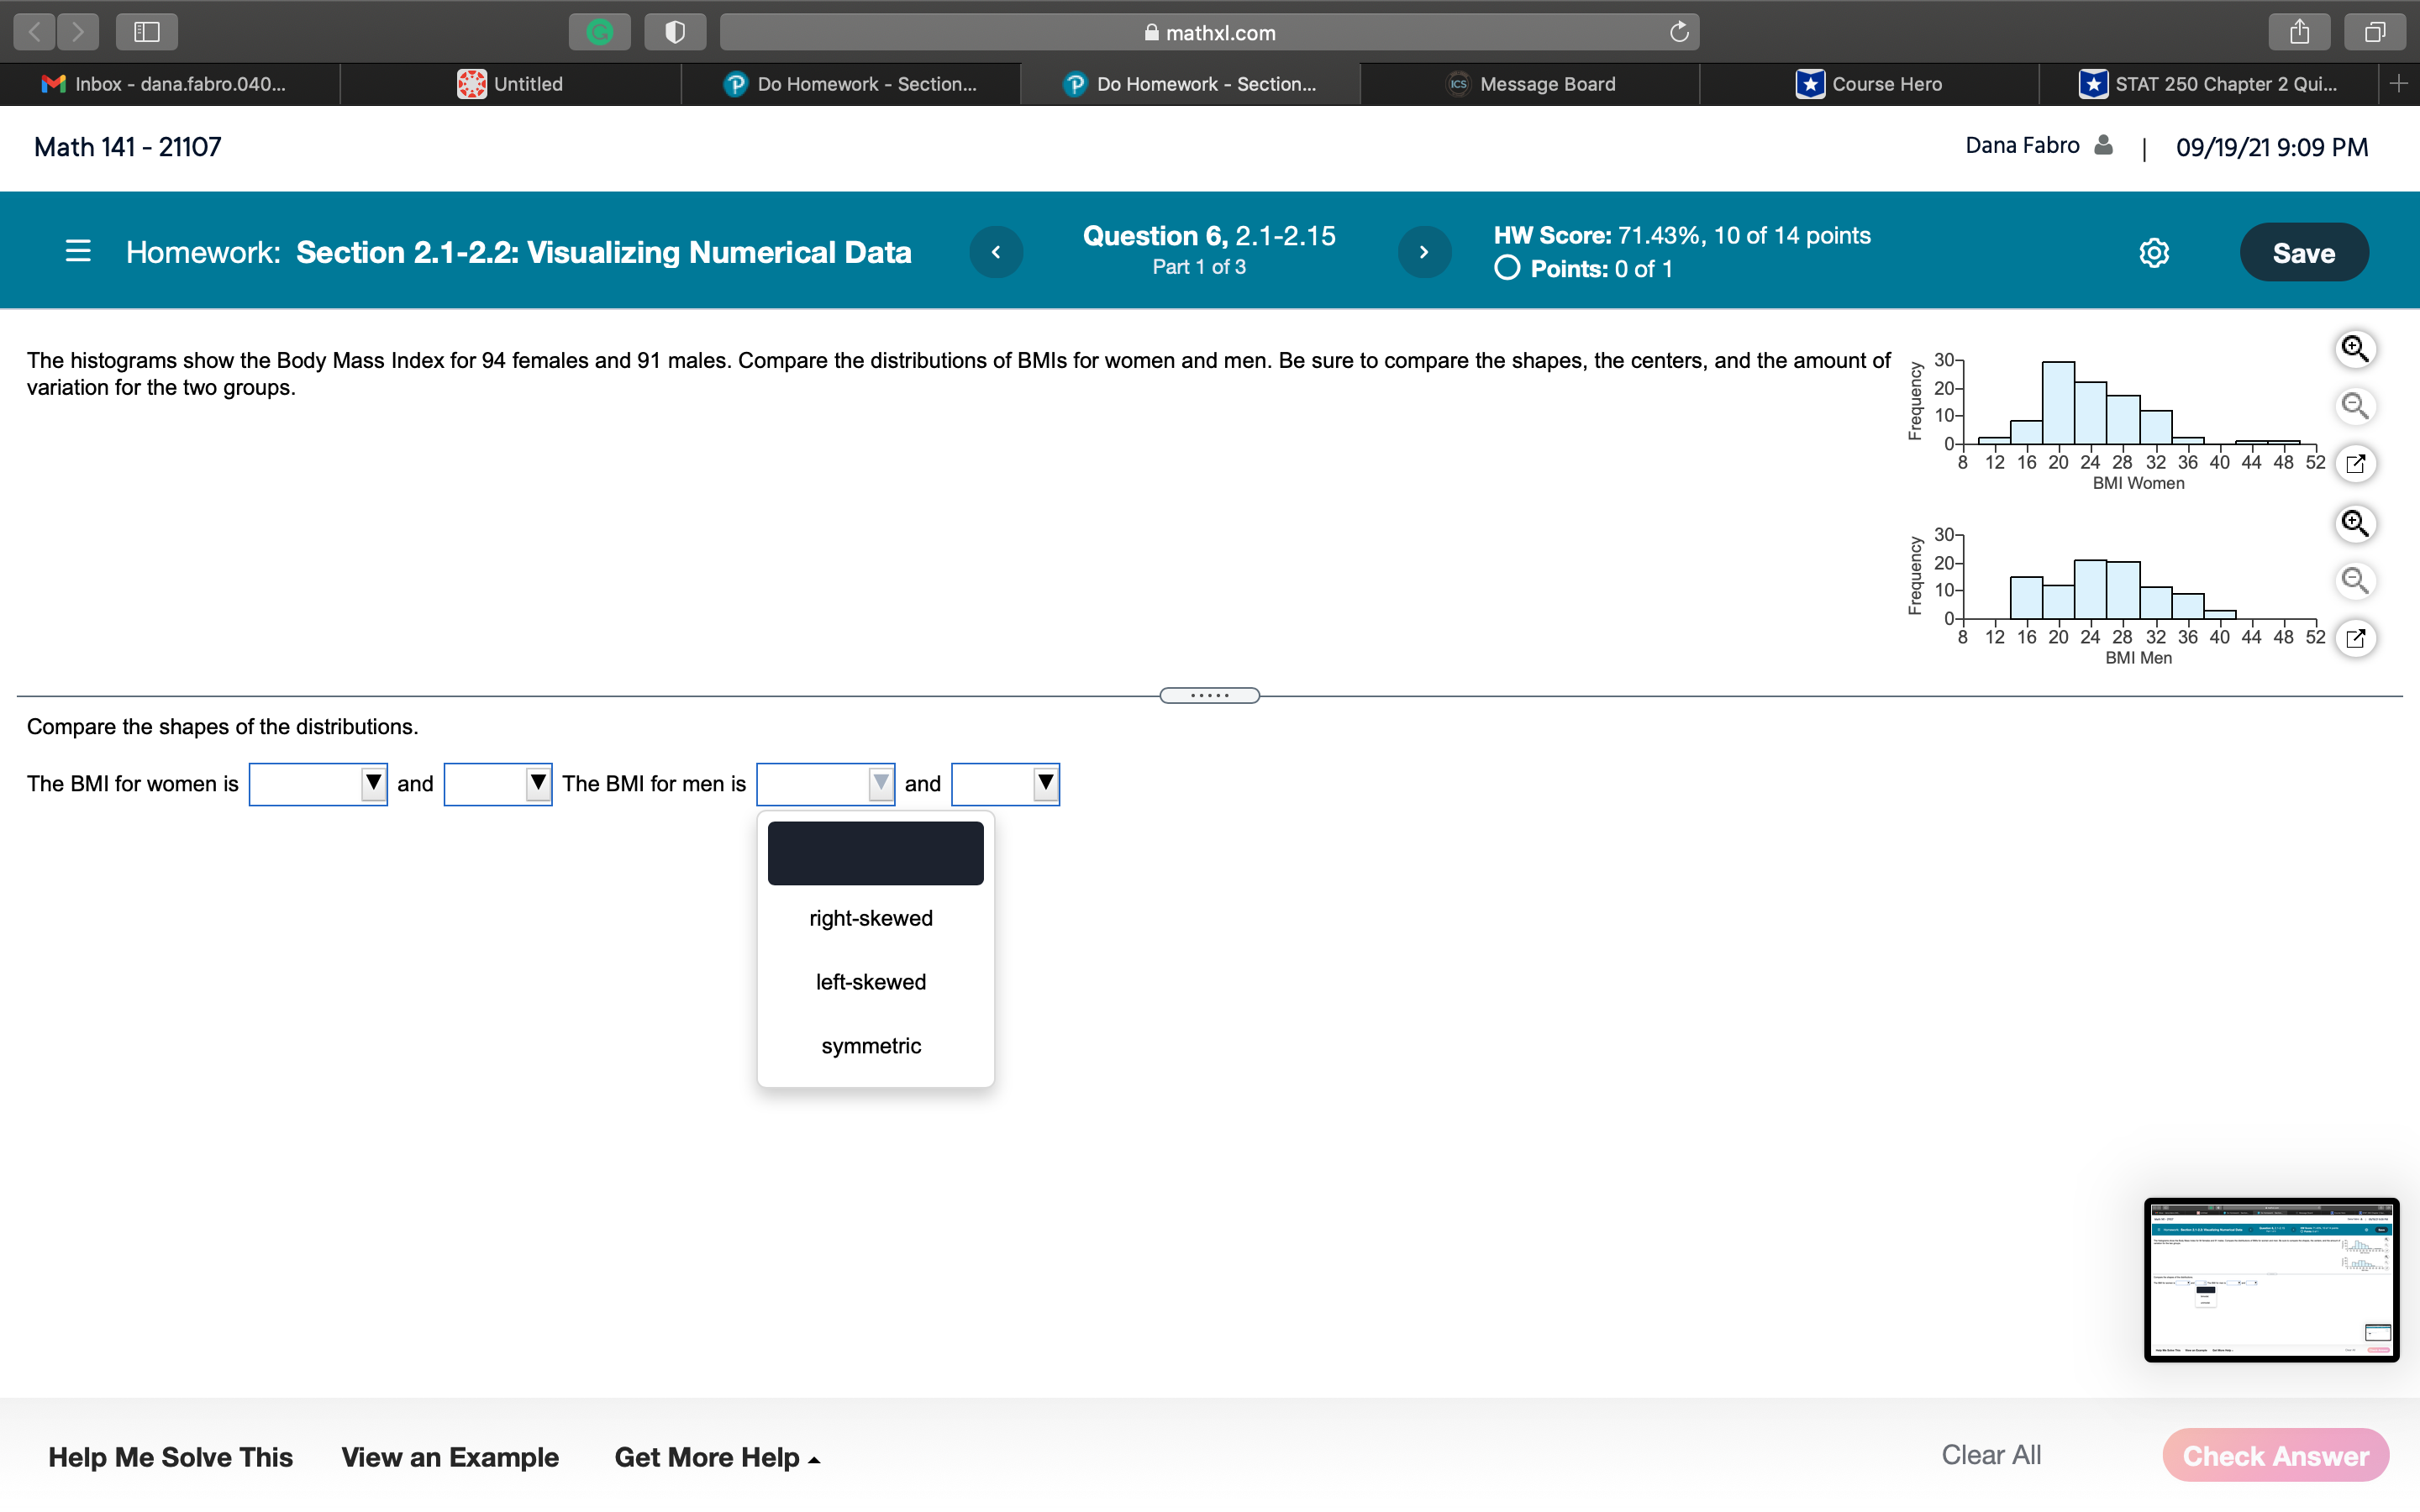
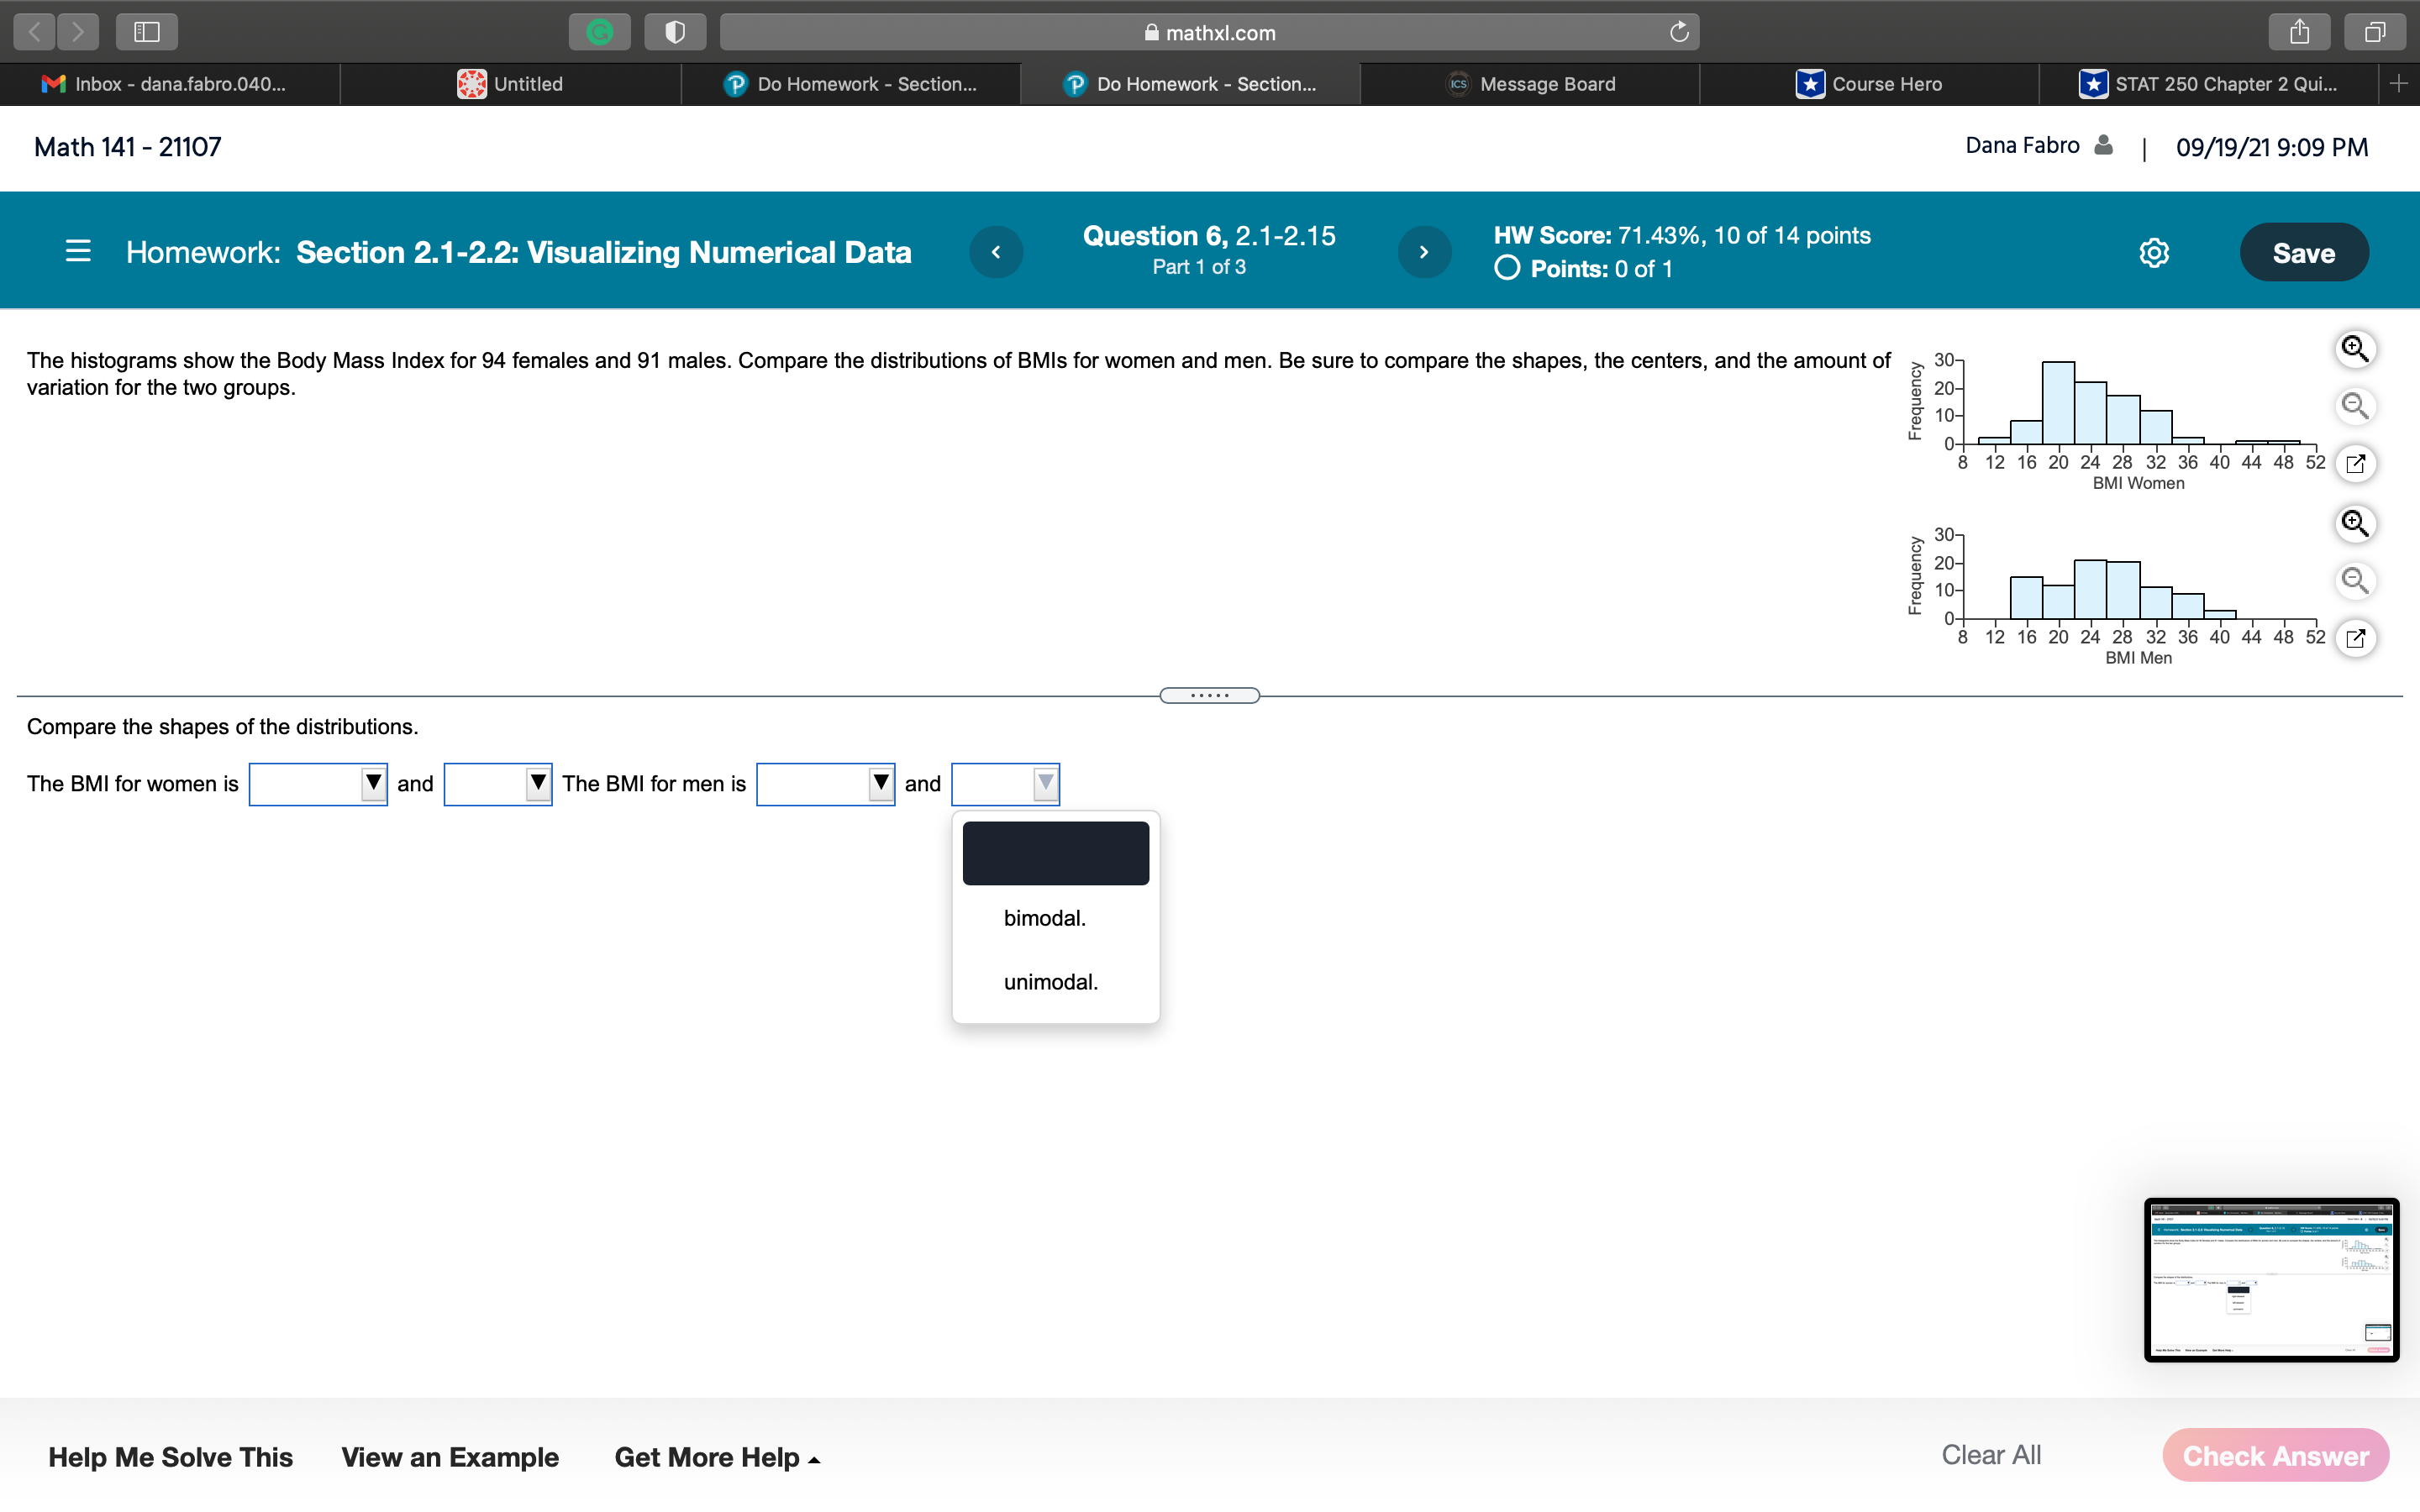
G mathxl.com C MInbox - dana.fabro.040... Untitled Do Homework - Section... P Do Homework - Section... Ics) Message Board Course Hero STAT 250 Chapter 2 Qui.. Math 141 - 21107 Dana Fabro | 09/19/219:09 PM Homework: Section 2.1-2.2: Visualizing Numerical Data Question 6, 2.1-2.15 HW Score: 71.43%, 10 of 14 points Save Part 1 of 3 O Points: 0 of 1 The histograms show the Body Mass Index for 94 females and 91 males. Compare the distributions of BMIs for women and men. Be sure to compare the shapes, the centers, and the amount of 30- variation for the two groups 20- Frequency 10 - 8 12 16 20 24 28 32 36 40 44 48 52 BMI Women 30- Frequency 10 - of 8 12 16 20 24 28 32 36 40 44 48 52 BMI Men Compare the shapes of the distributions. The BMI for women is and The BMI for men is and V symmetric left-skewed right-skewed Help Me Solve This View an Example Get More Help - Clear All Check Answer G mathxl.com C MInbox - dana.fabro.040... Untitled Do Homework - Section... P Do Homework - Section... Ics) Message Board Course Hero STAT 250 Chapter 2 Qui.. Math 141 - 21107 Dana Fabro | 09/19/219:09 PM Homework: Section 2.1-2.2: Visualizing Numerical Data Question 6, 2.1-2.15 HW Score: 71.43%, 10 of 14 points Save Part 1 of 3 O Points: 0 of 1 The histograms show the Body Mass Index for 94 females and 91 males. Compare the distributions of BMIs for women and men. Be sure to compare the shapes, the centers, and the amount of 30- variation for the two groups 20- Frequency 10 - 8 12 16 20 24 28 32 36 40 44 48 52 BMI Women 30- Frequency 10 - of 8 12 16 20 24 28 32 36 40 44 48 52 BMI Men Compare the shapes of the distributions. The BMI for women is and The BMI for men is |and V bimodal. unimodal. Help Me Solve This View an Example Get More Help - Clear All Check Answer G mathxl.com C MInbox - dana.fabro.040... Untitled Do Homework - Section... P Do Homework - Section... Ics) Message Board Course Hero STAT 250 Chapter 2 Qui.. Math 141 - 21107 Dana Fabro | 09/19/219:09 PM Homework: Section 2.1-2.2: Visualizing Numerical Data Question 6, 2.1-2.15 HW Score: 71.43%, 10 of 14 points Save Part 1 of 3 O Points: 0 of 1 The histograms show the Body Mass Index for 94 females and 91 males. Compare the distributions of BMIs for women and men. Be sure to compare the shapes, the centers, and the amount of 30- variation for the two groups 20- Frequency 10 - 8 12 16 20 24 28 32 36 40 44 48 52 BMI Women 30- Frequency 10 - of 8 12 16 20 24 28 32 36 40 44 48 52 BMI Men Compare the shapes of the distributions. The BMI for women is and The BMI for men is and right-skewed left-skewed symmetric Help Me Solve This View an Example Get More Help - Clear All Check Answer G mathxl.com C MInbox - dana.fabro.040... Untitled Do Homework - Section... P Do Homework - Section... Ics) Message Board Course Hero STAT 250 Chapter 2 Qui.. Math 141 - 21107 Dana Fabro | 09/19/219:09 PM Homework: Section 2.1-2.2: Visualizing Numerical Data Question 6, 2.1-2.15 HW Score: 71.43%, 10 of 14 points Save Part 1 of 3 O Points: 0 of 1 The histograms show the Body Mass Index for 94 females and 91 males. Compare the distributions of BMIs for women and men. Be sure to compare the shapes, the centers, and the amount of 30- variation for the two groups 20- Frequency 10 - 8 12 16 20 24 28 32 36 40 44 48 52 BMI Women 30- Frequency 10 - of 8 12 16 20 24 28 32 36 40 44 48 52 BMI Men Compare the shapes of the distributions. The BMI for women is and The BMI for men is and bimodal. unimodal. Help Me Solve This View an Example Get More Help - Clear All Check