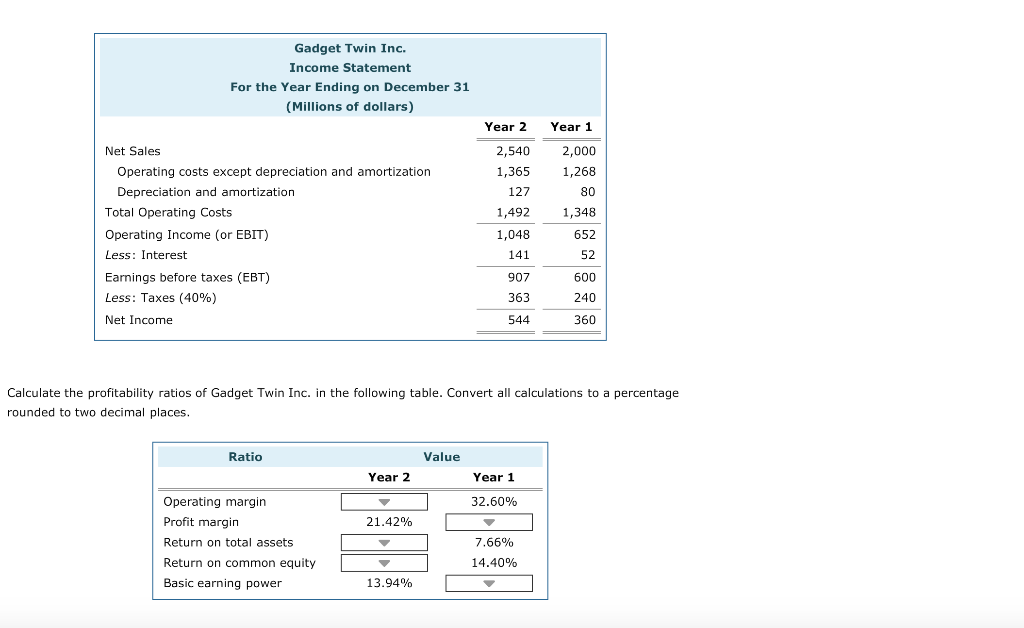
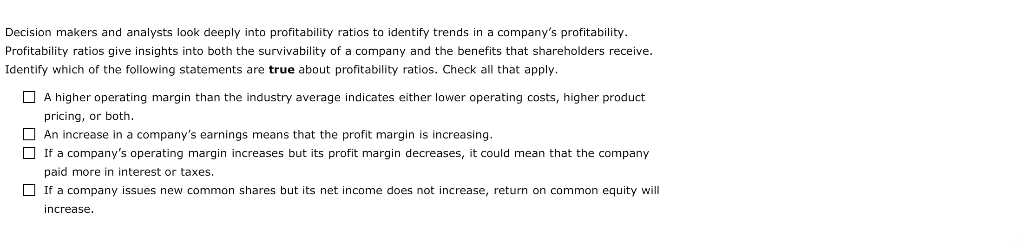
Gadget Twin Inc. Income Statement For the Year Ending on December 31 (Millions of dollars) Year 2 2,540 1,365 127 1,492 1,048 141 907 363 544 Year 1 2,000 1,268 80 1,348 652 52 600 240 360 Net Sales Operating costs except depreciation and amortization Depreciation and amortization Total Operating Costs Operating Income (or EBIT) Less: Interest Earnings before taxes (EBT) Less: Taxes (40%) Net Income Calculate the profitability ratios of Gadget Twin Inc. in the following table. Convert all calculations to a percentage rounded to two decimal places Ratio Value Year 2 Year 1 32.60% Operating margin Profit margin Return on total assets Return on common equity Basic earning power 21.42% 7.66% 14.40% 13.94% Decision makers and analysts look deeply into profitability ratios to identify trends in a company's profitability Profitability ratios give insights into both the survivability of a company and the benefits that shareholders receive Identify which of the following statements are true about profitability ratios. Check all that apply A higher operating margin than the industry average indicates either lower operating costs, higher product pricing, or both. An increase in a company's earnings means that the profit margin is increasing If a company's operating margin increases but its profit margin decreases, it could mean that the company paid more in interest or taxes. If a company issues new common shares but its net income does not increase, return on common equity wil increase. Gadget Twin Inc. Income Statement For the Year Ending on December 31 (Millions of dollars) Year 2 2,540 1,365 127 1,492 1,048 141 907 363 544 Year 1 2,000 1,268 80 1,348 652 52 600 240 360 Net Sales Operating costs except depreciation and amortization Depreciation and amortization Total Operating Costs Operating Income (or EBIT) Less: Interest Earnings before taxes (EBT) Less: Taxes (40%) Net Income Calculate the profitability ratios of Gadget Twin Inc. in the following table. Convert all calculations to a percentage rounded to two decimal places Ratio Value Year 2 Year 1 32.60% Operating margin Profit margin Return on total assets Return on common equity Basic earning power 21.42% 7.66% 14.40% 13.94% Decision makers and analysts look deeply into profitability ratios to identify trends in a company's profitability Profitability ratios give insights into both the survivability of a company and the benefits that shareholders receive Identify which of the following statements are true about profitability ratios. Check all that apply A higher operating margin than the industry average indicates either lower operating costs, higher product pricing, or both. An increase in a company's earnings means that the profit margin is increasing If a company's operating margin increases but its profit margin decreases, it could mean that the company paid more in interest or taxes. If a company issues new common shares but its net income does not increase, return on common equity wil increase.