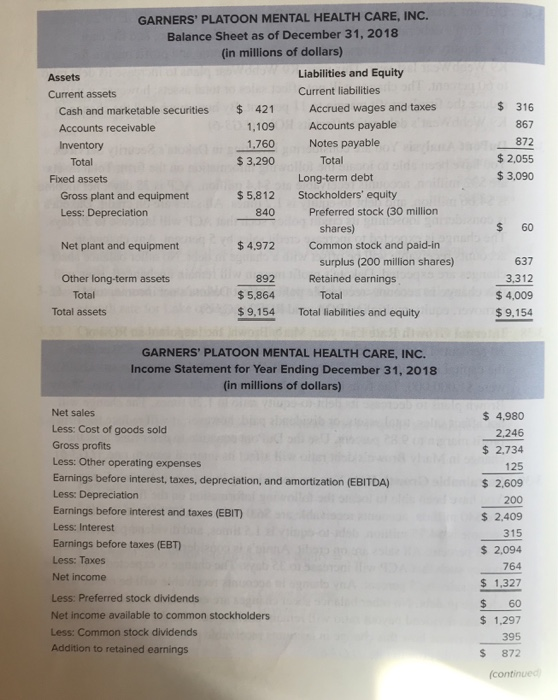
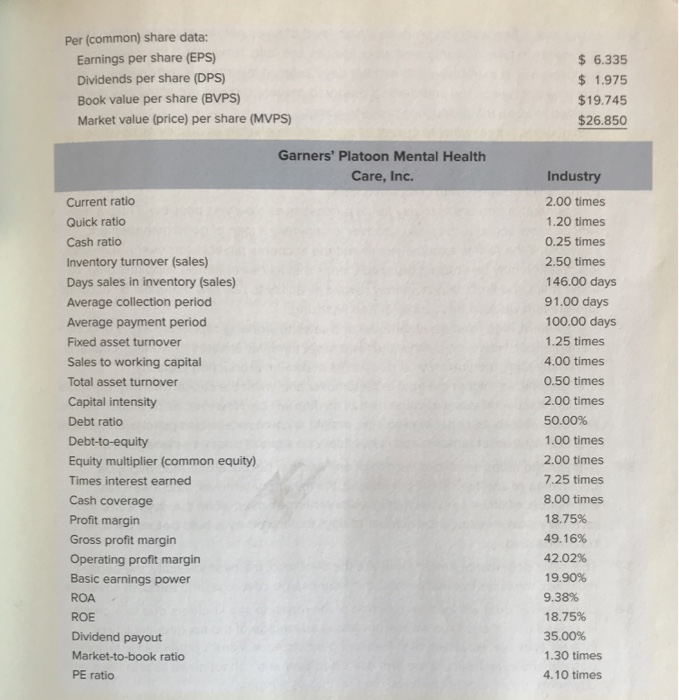
GARNERS' PLATOON MENTAL HEALTH CARE, INC Balance Sheet as of December 31, 2018 (in millions of dollars) Assets Current assets Liabilities and Equity Current liabilities $ 316 867 872 $2,055 $ 3.090 Accrued wages and taxes Cash and marketable securities Accounts receivable Inventory $421 1,109 Accounts payable 1.760 Notes payable Total $ 3,290 Total Flixed assets Long-term dett Gross plant and equipment $5,812 Stockholders' equity Preferred stock (30 million Less: Depreciation Net plant and equipment Other long-term assets 840 $ 60 shares) Common stock and paid-in $4,972 637 3,312 $4,009 $ 9,154 surplus (200 million shares) Retained earnings 892 $ 5,864 $9,154 Total Total Total assets Total liabilities and equity GARNERS' PLATOON MENTAL HEALTH CARE, INC Income Statement for Year Ending December 31, 2018 (in millions of dollars) Net sales Less: Cost of goods sold Gross profits Less: Other operating expenses Earnings before interest, taxes, depreciation, and amortization (EBITDA) Less: Depreciation Earnings before interest and taxes (EBIT Less: Interest $ 4.980 2,246 $2,734 125 s 2,609 200 2,409 315 2,094 764 $1,327 $ 60 $1,297 395 S 872 Earnings before taxes (EBT Less: Taxes Net income Less: Preferred stock dividends Net income available to common stockholders Less: Common stock dividends Addition to retained earnings (continued Per (common) share data: Earnings per share (EPS) Dividends per share (DPS) Book value per share (BVPS) Market value (price) per share (MVPS) 6.335 $1.975 $19.745 $26.850 Garners' Platoon Mental Health Care, Inc. Current ratio Quick ratico Cash ratio Inventory turnover (sales) Days sales in inventory (sales) Average collection period Average payment period Fixed asset turnover Sales to working capital Total asset turnover Capital intensity Debt ratio Debt-to-equity Equity multiplier (common equity) Times interest earned Cash coverage Profit margin Gross profit margin Operating profit margin Basic earnings power ROA ROE Dividend payout Market-to-book ratio PE ratio Industry 2.00 times 1.20 times 0.25 times 2.50 times 146.00 days 91.00 days 100.00 days 1.25 times 4.00 times 0.50 times 2.00 times 50.00% 1.00 times 2.00 times 7.25 times 8.00 times 18.75% 49.1 6% 42.02% 19.90% 9.38% 18.75% 35.00% 1.30 times 4.10 times GARNERS' PLATOON MENTAL HEALTH CARE, INC Balance Sheet as of December 31, 2018 (in millions of dollars) Assets Current assets Liabilities and Equity Current liabilities $ 316 867 872 $2,055 $ 3.090 Accrued wages and taxes Cash and marketable securities Accounts receivable Inventory $421 1,109 Accounts payable 1.760 Notes payable Total $ 3,290 Total Flixed assets Long-term dett Gross plant and equipment $5,812 Stockholders' equity Preferred stock (30 million Less: Depreciation Net plant and equipment Other long-term assets 840 $ 60 shares) Common stock and paid-in $4,972 637 3,312 $4,009 $ 9,154 surplus (200 million shares) Retained earnings 892 $ 5,864 $9,154 Total Total Total assets Total liabilities and equity GARNERS' PLATOON MENTAL HEALTH CARE, INC Income Statement for Year Ending December 31, 2018 (in millions of dollars) Net sales Less: Cost of goods sold Gross profits Less: Other operating expenses Earnings before interest, taxes, depreciation, and amortization (EBITDA) Less: Depreciation Earnings before interest and taxes (EBIT Less: Interest $ 4.980 2,246 $2,734 125 s 2,609 200 2,409 315 2,094 764 $1,327 $ 60 $1,297 395 S 872 Earnings before taxes (EBT Less: Taxes Net income Less: Preferred stock dividends Net income available to common stockholders Less: Common stock dividends Addition to retained earnings (continued Per (common) share data: Earnings per share (EPS) Dividends per share (DPS) Book value per share (BVPS) Market value (price) per share (MVPS) 6.335 $1.975 $19.745 $26.850 Garners' Platoon Mental Health Care, Inc. Current ratio Quick ratico Cash ratio Inventory turnover (sales) Days sales in inventory (sales) Average collection period Average payment period Fixed asset turnover Sales to working capital Total asset turnover Capital intensity Debt ratio Debt-to-equity Equity multiplier (common equity) Times interest earned Cash coverage Profit margin Gross profit margin Operating profit margin Basic earnings power ROA ROE Dividend payout Market-to-book ratio PE ratio Industry 2.00 times 1.20 times 0.25 times 2.50 times 146.00 days 91.00 days 100.00 days 1.25 times 4.00 times 0.50 times 2.00 times 50.00% 1.00 times 2.00 times 7.25 times 8.00 times 18.75% 49.1 6% 42.02% 19.90% 9.38% 18.75% 35.00% 1.30 times 4.10 times


