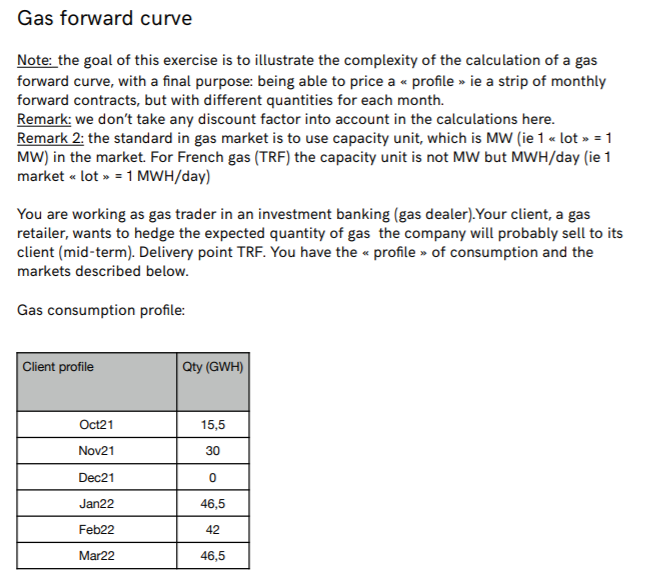
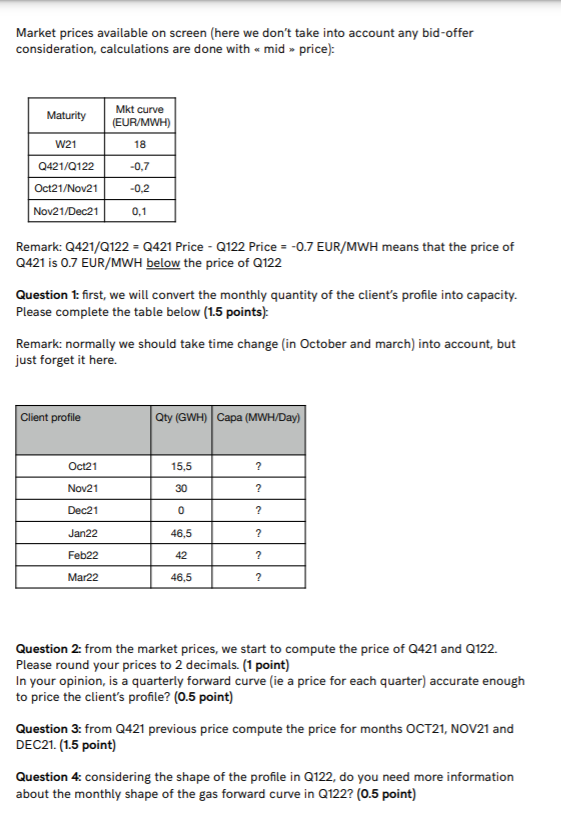
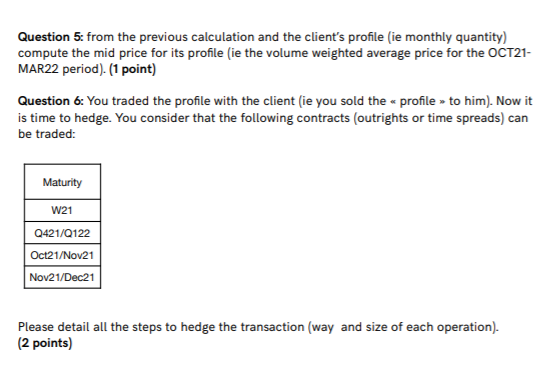
Gas forward curve Note: the goal of this exercise is to illustrate the complexity of the calculation of a gas forward curve, with a final purpose: being able to price a profile ie a strip of monthly forward contracts, but with different quantities for each month. Remark: we don't take any discount factor into account in the calculations here. Remark 2: the standard in gas market is to use capacity unit, which is MW (ie 1 lot = 1 MW) in the market. For French gas (TRF) the capacity unit is not MW but MWH/day (ie 1 market lot = 1 MWH/day) You are working as gas trader in an investment banking (gas dealer). Your client, a gas retailer, wants to hedge the expected quantity of gas the company will probably sell to its client (mid-term). Delivery point TRF. You have the profile of consumption and the markets described below. Gas consumption profile: Client profile Qty (GWH) 15,5 30 Oct21 Nov21 Dec21 Jan22 0 46,5 Feb22 42 Mar22 46,5 Market prices available on screen (here we don't take into account any bid-offer consideration, calculations are done with mid price): Maturity Mkt curve (EUR/MWH) 18 -0,7 W21 Q421/0122 Oct21/Nov21 Nov21/Dec21 -0,2 0,1 Remark: Q421/Q122 = Q421 Price - Q122 Price = -0.7 EUR/MWH means that the price of Q421 is 0.7 EUR/MWH below the price of Q122 Question 1: first, we will convert the monthly quantity of the client's profile into capacity. Please complete the table below (1.5 points) Remark: normally we should take time change in October and march) into account, but just forget it here. Client profile Qty (GWH) Capa (MWH/Day) Oct21 15,5 ? Nov21 30 ? 0 ? 46,5 ? Dec21 Jan22 Feb22 Mar22 42 ? 46,5 ? Question 2: from the market prices, we start to compute the price of Q421 and Q122. Please round your prices to 2 decimals. (1 point) In your opinion, is a quarterly forward curve (ie a price for each quarter) accurate enough to price the client's profile? (0.5 point) Question 3: from Q421 previous price compute the price for months OCT21, NOV21 and DEC21. (1.5 point) Question 4: considering the shape of the profile in Q122, do you need more information about the monthly shape of the gas forward curve in Q122? (0.5 point) Question 5: from the previous calculation and the client's profile (ie monthly quantity) compute the mid price for its profile (ie the volume weighted average price for the OCT21- MAR22 period). (1 point) Question 6: You traded the profile with the client (ie you sold the profile to him). Now it is time to hedge. You consider that the following contracts (outrights or time spreads) can be traded: Maturity W21 Q421/0122 Oct21/Nov21 Nov21/Dec21 Please detail all the steps to hedge the transaction (way and size of each operation). (2 points) Gas forward curve Note: the goal of this exercise is to illustrate the complexity of the calculation of a gas forward curve, with a final purpose: being able to price a profile ie a strip of monthly forward contracts, but with different quantities for each month. Remark: we don't take any discount factor into account in the calculations here. Remark 2: the standard in gas market is to use capacity unit, which is MW (ie 1 lot = 1 MW) in the market. For French gas (TRF) the capacity unit is not MW but MWH/day (ie 1 market lot = 1 MWH/day) You are working as gas trader in an investment banking (gas dealer). Your client, a gas retailer, wants to hedge the expected quantity of gas the company will probably sell to its client (mid-term). Delivery point TRF. You have the profile of consumption and the markets described below. Gas consumption profile: Client profile Qty (GWH) 15,5 30 Oct21 Nov21 Dec21 Jan22 0 46,5 Feb22 42 Mar22 46,5 Market prices available on screen (here we don't take into account any bid-offer consideration, calculations are done with mid price): Maturity Mkt curve (EUR/MWH) 18 -0,7 W21 Q421/0122 Oct21/Nov21 Nov21/Dec21 -0,2 0,1 Remark: Q421/Q122 = Q421 Price - Q122 Price = -0.7 EUR/MWH means that the price of Q421 is 0.7 EUR/MWH below the price of Q122 Question 1: first, we will convert the monthly quantity of the client's profile into capacity. Please complete the table below (1.5 points) Remark: normally we should take time change in October and march) into account, but just forget it here. Client profile Qty (GWH) Capa (MWH/Day) Oct21 15,5 ? Nov21 30 ? 0 ? 46,5 ? Dec21 Jan22 Feb22 Mar22 42 ? 46,5 ? Question 2: from the market prices, we start to compute the price of Q421 and Q122. Please round your prices to 2 decimals. (1 point) In your opinion, is a quarterly forward curve (ie a price for each quarter) accurate enough to price the client's profile? (0.5 point) Question 3: from Q421 previous price compute the price for months OCT21, NOV21 and DEC21. (1.5 point) Question 4: considering the shape of the profile in Q122, do you need more information about the monthly shape of the gas forward curve in Q122? (0.5 point) Question 5: from the previous calculation and the client's profile (ie monthly quantity) compute the mid price for its profile (ie the volume weighted average price for the OCT21- MAR22 period). (1 point) Question 6: You traded the profile with the client (ie you sold the profile to him). Now it is time to hedge. You consider that the following contracts (outrights or time spreads) can be traded: Maturity W21 Q421/0122 Oct21/Nov21 Nov21/Dec21 Please detail all the steps to hedge the transaction (way and size of each operation). (2 points)