Question
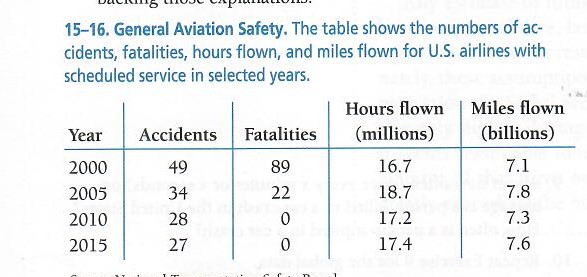
General Aviation Safety. Table shows the number of accidents, fatalities, hours flown, for U.S. airlines scheduled service in selected years. a. Compose the accident rate
General Aviation Safety. Table shows the number of accidents, fatalities, hours flown, for U.S. airlines scheduled service in selected years.
a. Compose the accident rate per million hours flown in 2000 and 2015. By this measure, has traveled on U.S. airlines become safer?
The answer for A is 2,000; 2.9 accidents per 1 million hours flown; in 2015; 1.6 accidents per 1 million hours flown.
b. Compute the accident rate per billion miles flown in 2000 and 2015. By this measure, has travel on U.S. airlines become safer?
The answer for B is 2,000; 6.9 accidents per 1 billion miles flown; in 2015; 3.6 accidents per 1 billion miles flown.
Please use the table attached to solve the problem. Please answer with short and concise answers with proper grammar, punctuation and do not leave words out. Please use clean handwriting. This is from Math 140 Statistic and Probability. Thank you.

Step by Step Solution
There are 3 Steps involved in it
Step: 1

Get Instant Access to Expert-Tailored Solutions
See step-by-step solutions with expert insights and AI powered tools for academic success
Step: 2

Step: 3

Ace Your Homework with AI
Get the answers you need in no time with our AI-driven, step-by-step assistance
Get Started


