

Question
General Electrics (GE) 2017 Annual Report - Key Performance Indicators Key Performance Indicator - KPI Directions: What are KPI included in GE annual report. For
General Electrics (GE) 2017 Annual Report - Key Performance Indicators
Key Performance Indicator - KPI
Directions:
What are KPI included in GE annual report.
For each KPI explain what method is used to report them.
Why different methods has been used to report different KPI.
What do you think is a benefit of using visual reporting vs. text for GE. Give examples from the Annual Report.
Any additional conclusions or observations you made looking on the way GE uses data visualizations in the report (not necessarily for KPI)
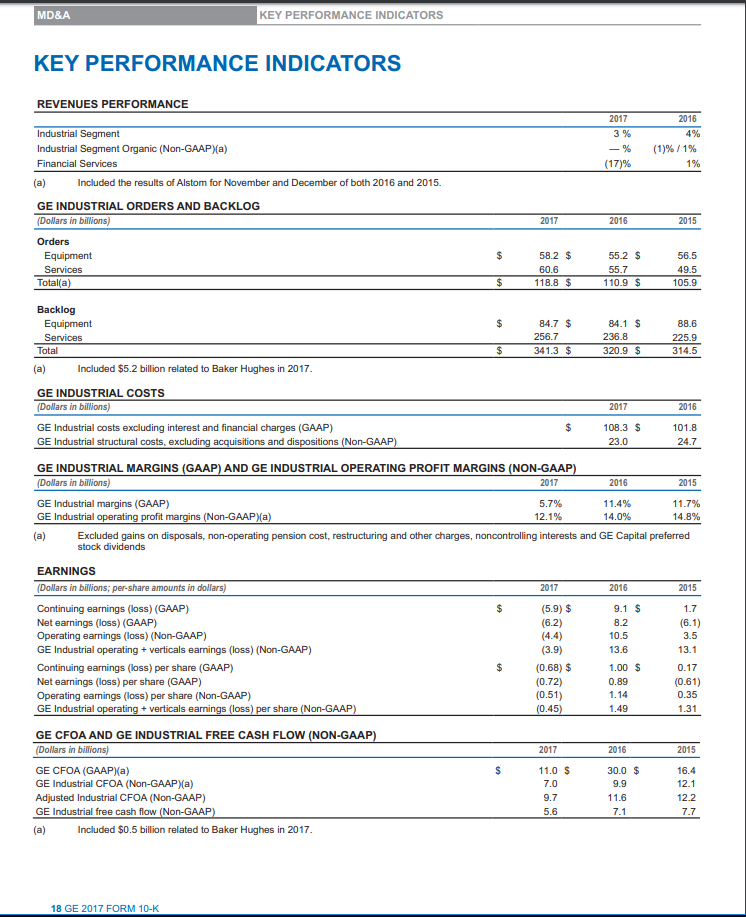
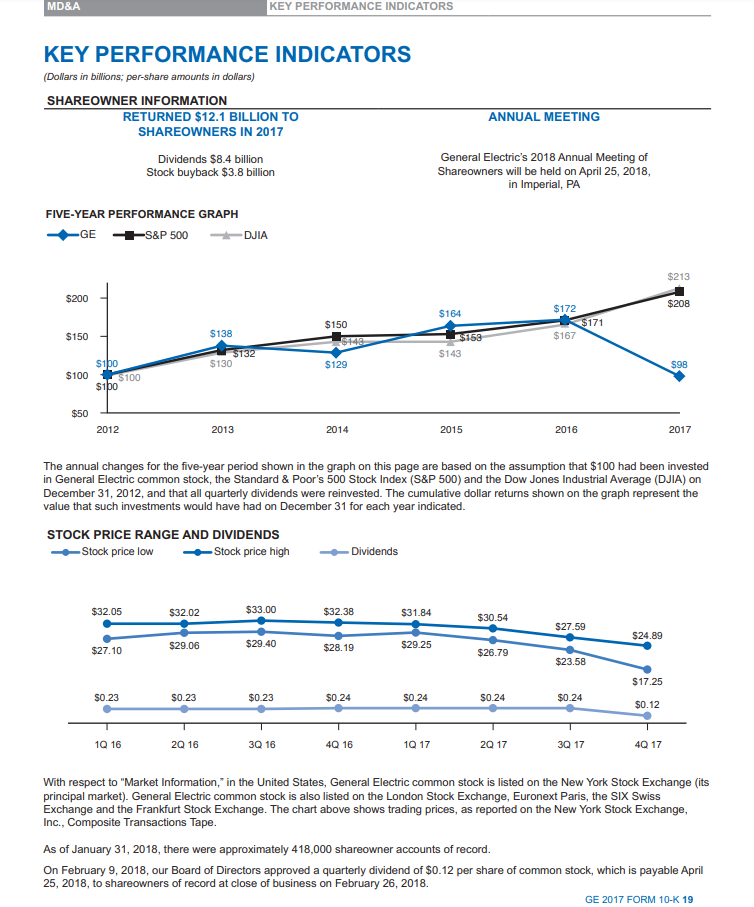
KEY PERFORMANCE INDICATORS MD&A KEY PERFORMANCE INDICATORS REVENUES PERFORMANCE 2017 2016 Industrial Segment 3% 4% Industrial Segment Organic (Non-GAAP)a) % (1)% / 1% Financial Services (17)% 1% (a) Included the results of Alstom for November and December of both 2016 and 2015 GE INDUSTRIAL ORDERS AND BACKLOG (Dollars in billions) 2017 2016 2015 Orders $ 58.2 $ Equipment 55.2 56.5 Services Total(a) 60.6 55.7 49.5 $ 118.8 $ 110.9 $ 105.9 Backlog $ 84.1 $ Equipment 84.7 $ 88.6 236.8 256.7 Services 225.9 Total $ 320.9 $ 341.3 $ 314.5 Included $5.2 billion related to Baker Hughes in 2017 (a) GE INDUSTRIAL COSTS (Dollars in billions) 2017 2016 GE Industrial costs excluding interest and financial charges (GAAP) 108.3 101.8 GE Industrial structural costs, excluding acquisitions and dispositions (Non-GAAP) 23.0 24.7 GE INDUSTRIAL MARGINS (GAAP) AND GE INDUSTRIAL OPERATING PROFIT MARGINS (NON-GAAP) (Dollars in billions) 2017 2016 2015 GE Industrial margins (GAAP) GE Industrial operating profit margins (Non-GAAP)(a) 5.7% 11.4% 11.7% 12.1% 14.0% 14.8% (a) Excluded gains on disposals, non-operating pension oost, restructuring and other charges, noncontrolling interests and GE Capital preferred stock dividends EARNINGS (Dollars in billions; per-share amounts in dollars) 2017 2016 2015 $ (5.9) $ Continuing earnings (loss) (GAAP) 9.1 1.7 Net earnings (loss) (GAAP) Operating earnings (loss) (Non-GAAP) (6.2) 8.2 (6.1) (4.4) 10.5 3.5 GE Industrial operating+verticals earnings (loss) (Non-GAAP) (3.9) 13.6 13.1 $ (0.68) 1.00 $ Continuing earnings (loss) per share (GAAP) 0.17 Net earnings (loss) per share (GAAP) (0.72) (0.51) 0.89 (0.61) 1.14 0.35 Operating eamings (loss) per share (Non-GAAP) GE Industrial operating+ verticals earnings (loss) per share (Non-GAAP) (0.45) 1.49 1.31 GE CFOA AND GE INDUSTRIAL FREE CASH FLOW (NON-GAAP) (Dollars in billions) 2017 2016 2015 11.0 $ 30.0 $ GE CFOA (GAAP(a) GE Industrial CFOA (Non-GAAP)(a) 16.4 7.0 9.9 12.1 Adjusted Industrial CFOA (Non-GAAP) GE Industrial free cash flow (Non-GAAP) 9.7 11.6 12.2 5.6 7.1 7.7 Included $0.5 billion related to Baker Hughes in 2017. (a) 18 GE 2017 FORM 10-K KEY PERFORMANCE INDICATORS MD&A KEY PERFORMANCE INDICATORS (Dollars in billions; per-share amounts in dollars) SHAREOWNER INFORMATION RETURNED $12.1 BILLION TO SHAREOWNERS IN 2017 ANNUAL MEETING General Electric's 2018 Annual Meeting of Dividends $8.4 billion Stock buyback $3.8 billion Shareowners will be held on April 25, 2018, in Imperial, PA FIVE-YEAR PERFORMANCE GRAPH GE +S&P 500 DJIA $213 $200 $208 $172 $164 $171 $150 $138 $158 $167 $150 $148 $132 $130 $143 $100 $100 $100 $100 $129 $98 $50 2012 2013 2014 2015 2016 2017 The annual changes for the five-year period shown in the graph on this page are based on the assumption that $100 had been invested in General Electric common stock, the Standard & Poor's 500 Stock Index (S&P 500) and the Dow Jones Industrial Average (DJIA) on December 31, 2012, and that all quarterly dividends were reinvested. The cumulative dollar returns shown on the graph represent the value that such investments would have had on December 31 for each year indicated STOCK PRICE RANGE AND DIVIDENDS - Stock price low -Stock price high Dividends $33.00 $32.05 $32.38 $32.02 $31.84 $30.54 $27.59 $24.89 $29.4 $29.25 $29.06 $28.19 $27.10 $26.79 $23.58 $17.25 $0.23 S0.23 $0.23 $0.24 $0.24 $0.24 $0.24 $0.12 4Q 17 1Q 16 2Q 16 3Q 16 4Q 16 1Q 17 2Q 17 3Q 17 With respect to "Market Information," in the United States, General Electric common stock is listed on the New York Stock Exchange (its principal market). General Electric common stock is also listed on the London Stock Exchange, Euronext Paris, the SIX Swiss Exchange and the Frankfurt Stock Exchange. The chart above shows trading prices, as reported on the New York Stock Exchange, Inc., Composite Transactions Tape As of January 31, 2018, there were approximately 418,000 shareowner accounts of record. On February 9, 2018, our Board of Directors approved a quarterly dividend of $0.12 per share of common stock, which is payable April 25, 2018, to shareowners of record at close of business on February 26, 2018. GE 2017 FORM 10-K 19 CONSOLIDATED RESULTS PRESENTATION When used in this report, unless otherwise indicated by the context, we use the terms to mean the following: Continuing earnings -we refer to the caption "earnings from continuing operations attributable to GE common shareowners" as continuing earnings Continuing earnings per share (EPS)-when we refer to continu ing earnings per share, it is the diluted per-share amount of "earnings from continuing operations attributable to GE common shareowners. GE Industrial margin - GE revenues and other income excluding GE Capital earnings (loss) from continuing operations (GE Industrial revenues) minus GE total costs and expenses less GE interest and other financial charges divided by GE Industrial revenues Net earnings -we refer to the caption "net earnings attributable to GE common shareowners" as net earmnings. Net earnings per share (EPS)-when we refer to net earnings per share, it is the diluted per-share amount of "net earnings attributable to GE common shareowners." Operating earnings (Non-GAAP)- GE earnings from continuing operations attributable to common shareowners excluding the impact of non-operating pension costs. Organic revenues (Non-GAAP)-revenues excluding the effects of acquisitions, dispos itions and translational foreign currency exchange Revenues -revenues comprise sales of goods, sales of services and other income for our industrial businesses and GE Capital revenues from services for our financial services businesses. Segment profit -refers to the operating profit of the industrial segments and the net earnings of the Financial Services segment. See the Segment Operations section within the MD&A for a description of the basis for segment profits. Services for purposes of the financial statement display of sales and costs of sales in our Statement of Earnings (Loss), "goods" is required by SEC regulations to include all sales of tangible products, and "services" must include all other sales, including other services activities. In our MD&A section of this report, we refer to sales under product services agreements and sales of both goods (such as spare parts and equipment upgrades) and related services (such as monitoring, maintenance and repairs) as sales of "services," which is an important part of our operations 2017 SIGNIFICANT DEVELOPMENTS LEADERSHIP CHANGES As announced on June 12, 2017, Jeffrey R. Immelt retired as Chief Executive Officer (CEO) on July 31, 2017, and John L. Flannery succeeded Mr. Immelt as CEO effective August 1, 2017. Mr. Flannery also joined the Board of Directors (the Board) on that date. Mr Immelt remained Chairman of the Board for a transition period through October 2, 2017, at which point Mr. Flannery succeeded Mr. Immelt as Chairman On October 6, 2017, we announced that, effective November 1, 2017, Jamie S. Miller, would become Chief Financial Officer succeeding Jeffrey S. Bomstein. Mr. Bornstein remained a Vice Chairman through December 31, 2017. Ms. Miller also serves as a director at Baker Hughes, a GE company. On October 9, 2017, we announced that Robert Lane retired from the Board after 12 years of service, effective that same date. In addition, the Board elected Edward P. Garden as a director to fill the resulting vacancy, effective on that date. Mr. Garden is the Chief Investment Officer and a Founding Partner of Trian Fund Management, L.P. (Trian), an investment management firm. On December 8, 2017, we announced that Lowell C. McAdam resigned from the Board. We are also planning to significantly reduce the size of our Board at the 2018 annual meeting of shareowners and will nominate new directors with fresh perspectives and relevant expertise. 20 GE 2017 FORM 10-KStep by Step Solution
There are 3 Steps involved in it
Step: 1

Get Instant Access to Expert-Tailored Solutions
See step-by-step solutions with expert insights and AI powered tools for academic success
Step: 2

Step: 3
Ace Your Homework with AI
Get the answers you need in no time with our AI-driven, step-by-step assistance
Get Started
Finance For Non Financial Managers
Authors: Gene Siciliano
1st Edition
0071413774, 978-0071413770