

Question
* Generate 10 realizations of a 1000 random numbers with a uniform distribution (i.e. randn(10,1000)). Verify that each realization has a uniform distribution. Add the
* Generate 10 realizations of a 1000 random numbers with a uniform distribution (i.e. randn(10,1000)). Verify that each realization has a uniform distribution. Add the ten realizations using the function sum and observe the distribution of the result.
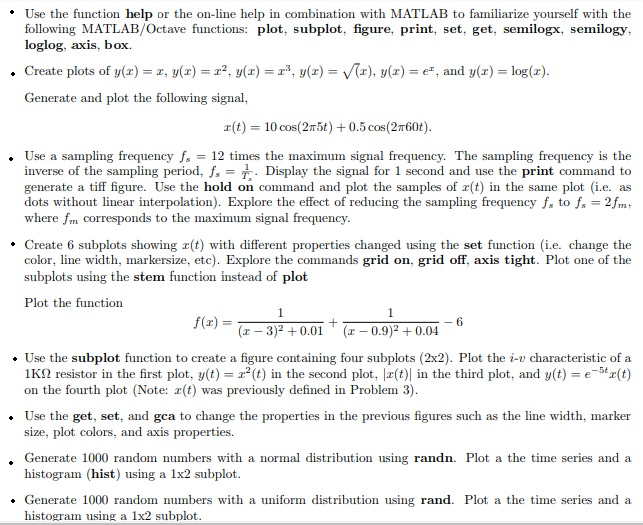
* Use the function help or the on-line help in combination with MATLAB to familiarize yourself with the following MATLAB/Octave functions: plot, subplot, figure, print, set, get, semilogx, semilogy loglog, axis, box. . Create plots of y(x) , y(x)2, y) 3, y(z) -), y(z) e, and y(x) log(x). Generate and plot the following signal, x(t) = 10 cos(2n5t) + 0.5 cos(2n60) . Use a sampling frequency fs 12 times the maximum signal frequency. The sampling frequency is the inverse of the sampling period, f, Display the signal for 1 second and use the print command to generate a tiff figure. Use the hold on command and plot the samples of r(t) in the same plot (i.e. as dots without linear interpolation). Explore the effect of reducing the sampling frequency fs to f, 2fm where fm corresponds to the maximum signal frequency *Create 6 subplots showing z(t) with different properties changed using the set function (i.e. change the color, line width, markersize, etc). Explore the commands grid on, grid off, axis tight. Plot one of the subplots using the stem function instead of plot Plot the function f(x)- 3)20.01 (r 0.9)2 +0.04 . Use the subplot function to create a figure containing four subplots (2x2). Plot the i-v characteristic of a e-5t2(t) 1?? resistor in the first plot, y(t) 22(t) in the second plot, x(t) in the third plot, and y(t) on the fourth plot (Note: r(t) was previously defined in Problem 3) . Use the get, set, and gca to change the properties in the previous figures such as the line width, marker size, plot colors, and axis properties. Generate 1000 random numbers with a normal distribution using randn. Plot a the time series and a histogram (hist) using a 1x2 subplot . Generate 1000 random numbers with a uniform distribution using rand. Plot a the time series and a histogram using a 1x2 subplot * Use the function help or the on-line help in combination with MATLAB to familiarize yourself with the following MATLAB/Octave functions: plot, subplot, figure, print, set, get, semilogx, semilogy loglog, axis, box. . Create plots of y(x) , y(x)2, y) 3, y(z) -), y(z) e, and y(x) log(x). Generate and plot the following signal, x(t) = 10 cos(2n5t) + 0.5 cos(2n60) . Use a sampling frequency fs 12 times the maximum signal frequency. The sampling frequency is the inverse of the sampling period, f, Display the signal for 1 second and use the print command to generate a tiff figure. Use the hold on command and plot the samples of r(t) in the same plot (i.e. as dots without linear interpolation). Explore the effect of reducing the sampling frequency fs to f, 2fm where fm corresponds to the maximum signal frequency *Create 6 subplots showing z(t) with different properties changed using the set function (i.e. change the color, line width, markersize, etc). Explore the commands grid on, grid off, axis tight. Plot one of the subplots using the stem function instead of plot Plot the function f(x)- 3)20.01 (r 0.9)2 +0.04 . Use the subplot function to create a figure containing four subplots (2x2). Plot the i-v characteristic of a e-5t2(t) 1?? resistor in the first plot, y(t) 22(t) in the second plot, x(t) in the third plot, and y(t) on the fourth plot (Note: r(t) was previously defined in Problem 3) . Use the get, set, and gca to change the properties in the previous figures such as the line width, marker size, plot colors, and axis properties. Generate 1000 random numbers with a normal distribution using randn. Plot a the time series and a histogram (hist) using a 1x2 subplot . Generate 1000 random numbers with a uniform distribution using rand. Plot a the time series and a histogram using a 1x2 subplotStep by Step Solution
There are 3 Steps involved in it
Step: 1

Get Instant Access to Expert-Tailored Solutions
See step-by-step solutions with expert insights and AI powered tools for academic success
Step: 2

Step: 3
Ace Your Homework with AI
Get the answers you need in no time with our AI-driven, step-by-step assistance
Get Started
Professional Microsoft SQL Server 2014 Integration Services
Authors: Brian Knight, Devin Knight
1st Edition
1118850904, 9781118850909