Answered step by step
Verified Expert Solution
Question
1 Approved Answer
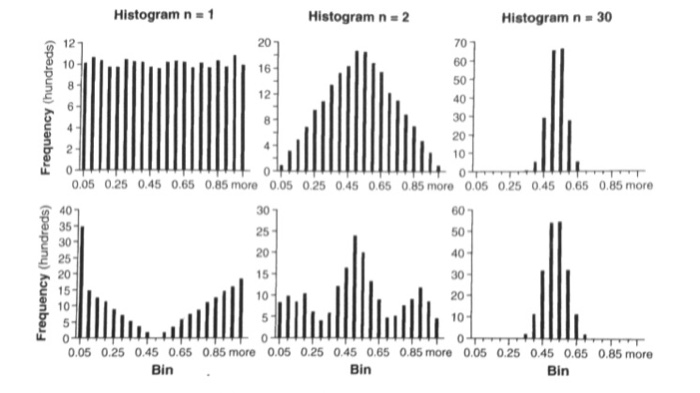
Generate a 2000-sample collection of random numbers between 0 and 1, with a mean of 0.5. This version of the sample will have a bimodal
Generate a 2000-sample collection of random numbers between 0 and 1, with a mean of 0.5.
This version of the sample will have a bimodal distribution (mostly high and low values), a little bit like the bottom left of Figure 4.2 (p.47) of Complex Adaptive Systems (by Miller and Page). Make a histogram of it. Then generate a second version of that 2000-sample collection, and take averages of pairs across these
versions. Make histogram of that (like the lower middle of Figure 4.2). Then generate 30 versions of the 2000-sample collection, and average across set of 30, and then make a histogram of that (like the bottom right of Figure 4.2). **You may need to shuffle (randperm) your vectors before averaging them.**

Step by Step Solution
There are 3 Steps involved in it
Step: 1

Get Instant Access to Expert-Tailored Solutions
See step-by-step solutions with expert insights and AI powered tools for academic success
Step: 2

Step: 3

Ace Your Homework with AI
Get the answers you need in no time with our AI-driven, step-by-step assistance
Get Started


