Answered step by step
Verified Expert Solution
Question
1 Approved Answer
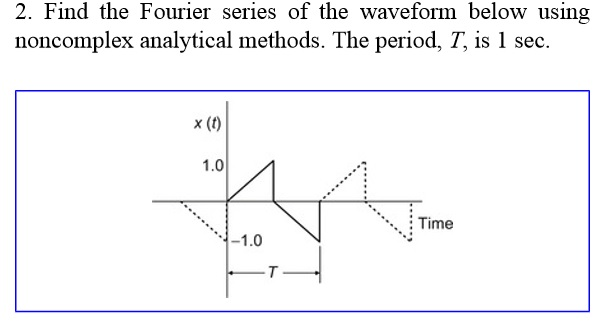
Generate the signal shown in Problem 2 (saw tooth wave) and use MATLAB to find the magnitude spectrum of this signal. Assume that the period,
Generate the signal shown in Problem 2 (saw tooth wave) and use MATLAB to find the magnitude spectrum of this signal. Assume that the period, T, is 1sec and assume a sampling frequency of 500-Hz; hence you will need to use 500 points to generate the signal. Plot the time domain signal, x(t), then calculate and plot the spectrum. Plot only the first 20 points plus the DC term and plot them as discrete points, not as a line plot. Note that every other frequency point is zero, as predicted by the symmetry of this signal.
Step by Step Solution
There are 3 Steps involved in it
Step: 1

Get Instant Access to Expert-Tailored Solutions
See step-by-step solutions with expert insights and AI powered tools for academic success
Step: 2

Step: 3

Ace Your Homework with AI
Get the answers you need in no time with our AI-driven, step-by-step assistance
Get Started


