Answered step by step
Verified Expert Solution
Link Copied!

Question

1 Approved Answer

generic logo company MEMORANDUM To: Junior Business Analyst From: Jamila Kanji, CEO Date: Week 5, 202x RE: Market Sizing Graphs Junior Business Analyst: Building on
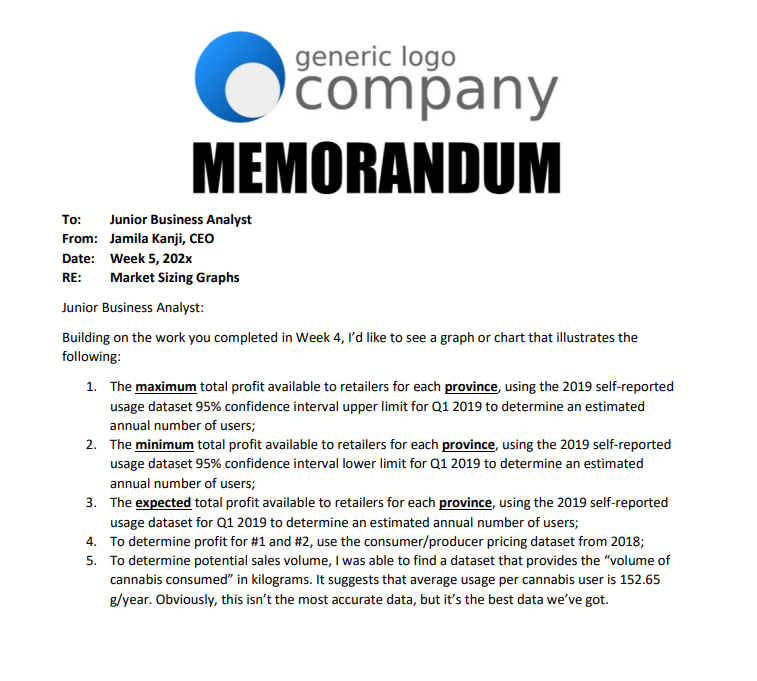
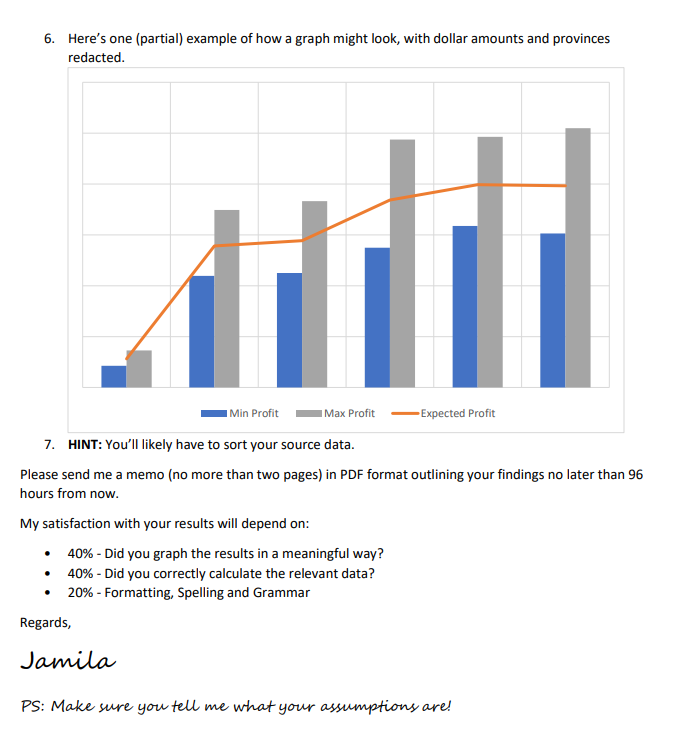
image text in transcribedimage text in transcribed
generic logo company MEMORANDUM To: Junior Business Analyst From: Jamila Kanji, CEO Date: Week 5, 202x RE: Market Sizing Graphs Junior Business Analyst: Building on the work you completed in Week 4, I'd like to see a graph or chart that illustrates the following: 1. The maximum total profit available to retailers for each province, using the 2019 self-reported usage dataset 95% confidence interval upper limit for Q1 2019 to determine an estimated annual number of users; 2. The minimum total profit available to retailers for each province, using the 2019 self-reported usage dataset 95% confidence interval lower limit for Q1 2019 to determine an estimated annual number of users; 3. The expected total profit available to retailers for each province, using the 2019 self-reported usage dataset for Q1 2019 to determine an estimated annual number of users; 4. To determine profit for #1 and #2, use the consumer/producer pricing dataset from 2018; 5. To determine potential sales volume, I was able to find a dataset that provides the "volume of cannabis consumed" in kilograms. It suggests that average usage per cannabis user is 152.65 g/year. Obviously, this isn't the most accurate data, but it's the best data we've got.6. Here's one (partial) example of how a graph might look, with dollar amounts and provinces redacted. Min Profit Max Profit Expected Profit 7. HINT: You'll likely have to sort your source data. Please send me a memo (no more than two pages) in PDF format outlining your findings no later than 96 hours from now. My satisfaction with your results will depend on: 40% - Did you graph the results in a meaningful way? 40% - Did you correctly calculate the relevant data? 20% - Formatting, Spelling and Grammar Regards, Jamila PS: Make sure you tell me what your assumptions are

Step by Step Solution

There are 3 Steps involved in it

Step: 1

blur-text-image

Get Instant Access to Expert-Tailored Solutions

See step-by-step solutions with expert insights and AI powered tools for academic success

Step: 2

blur-text-image

Step: 3

blur-text-image

Ace Your Homework with AI

Get the answers you need in no time with our AI-driven, step-by-step assistance

Get Started

Recommended Textbook for

Working In Teams Moving From High Potential To High Performance

Authors: Brian A. Griffith ,Ethan B. Dunham

1st Edition

1452286302, 978-1452286303

More Books

Students also viewed these General Management questions