

Question
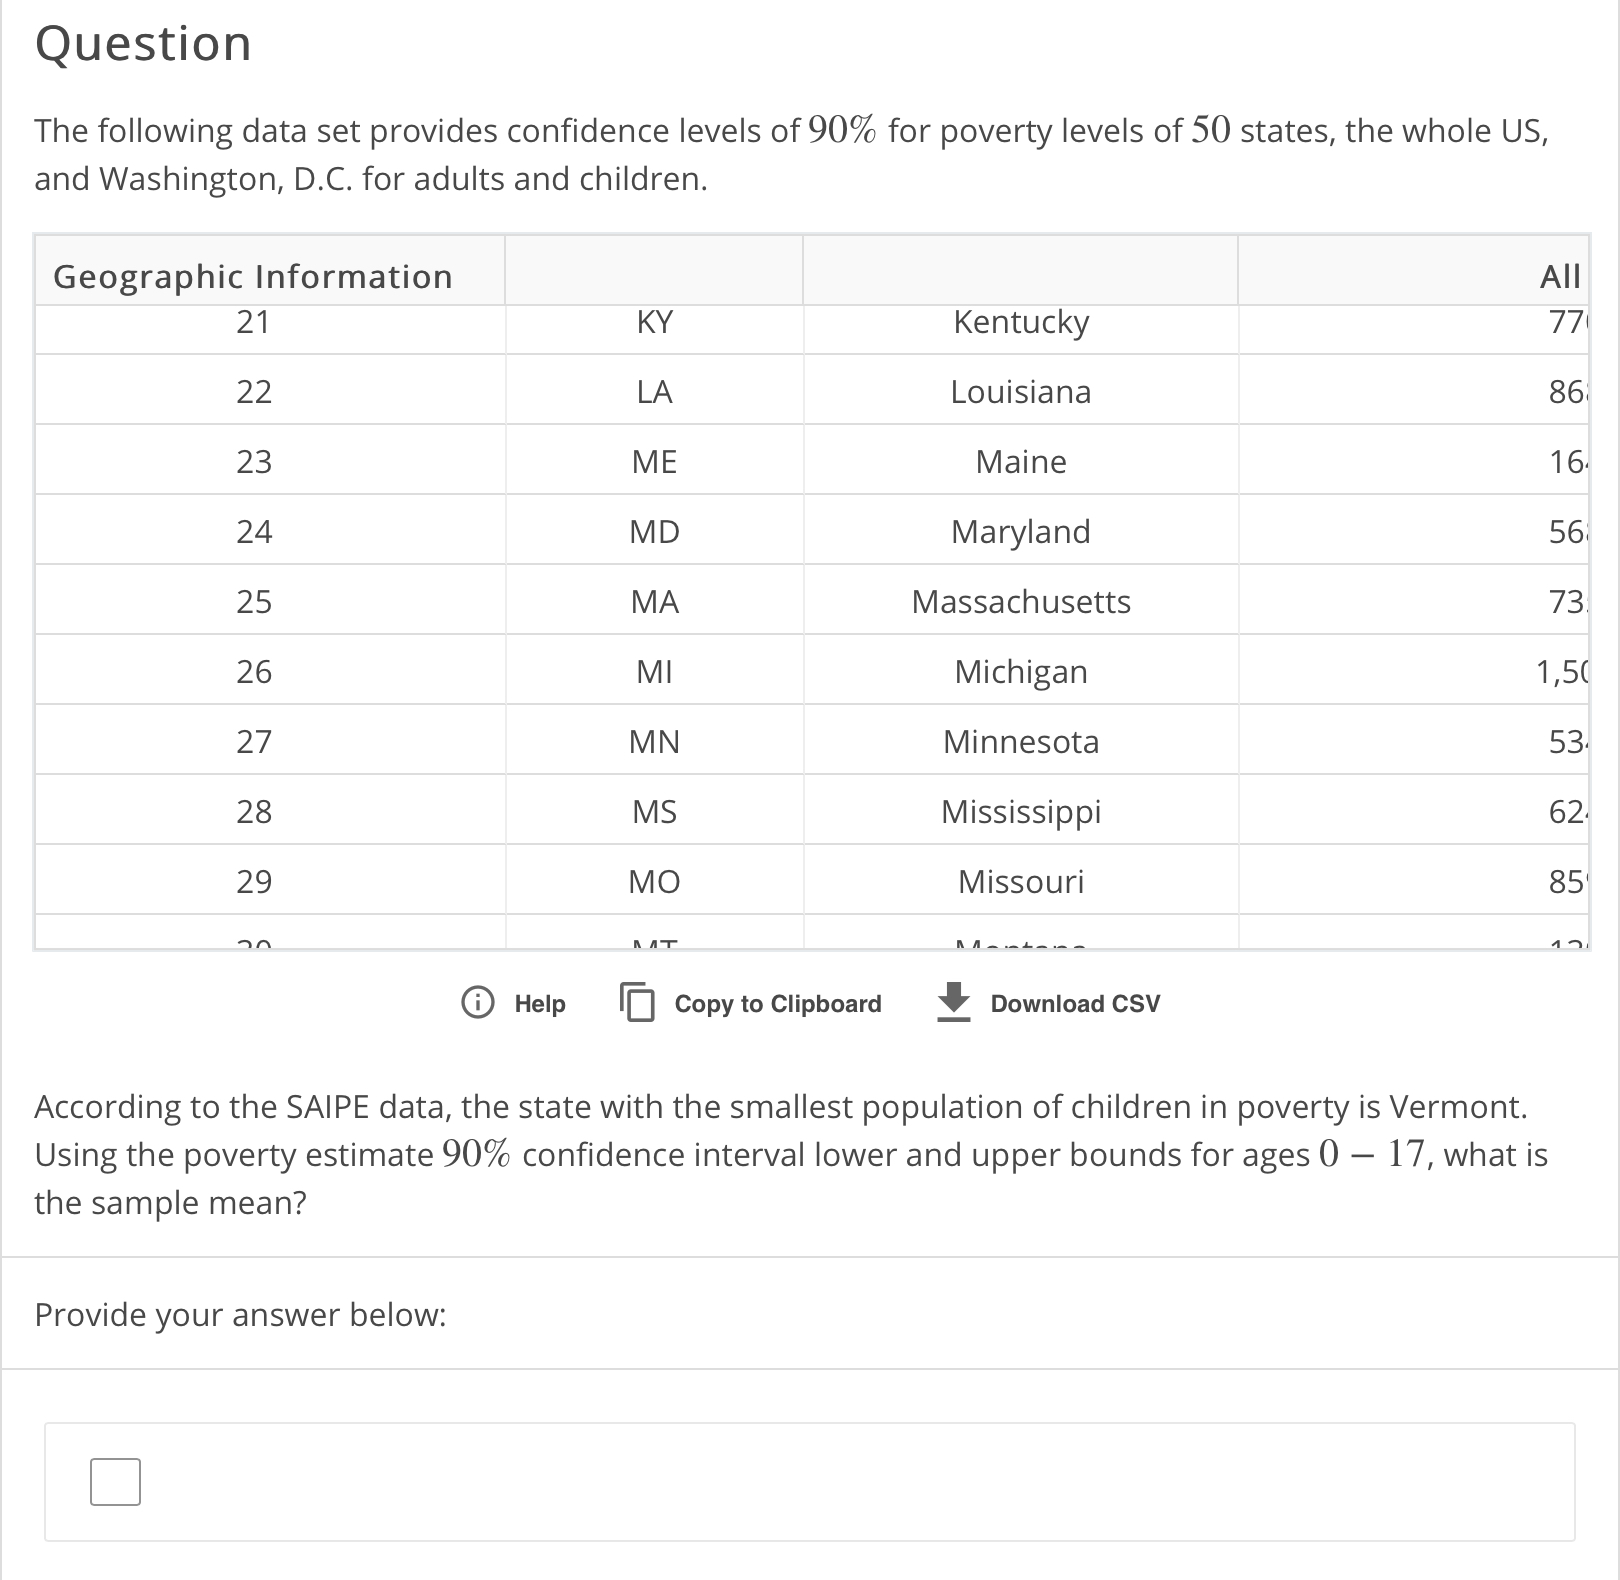
Geographic Information All Ages Age 0-17 Age 5-17 in Families Median Household Income Age 0-4 State FIPS Code Postal Code Name Poverty Estimate 90% CI
Geographic Information All Ages Age 0-17 Age 5-17 in Families Median Household Income Age 0-4
State FIPS Code Postal Code Name Poverty Estimate 90% CI Lower Bound Poverty Estimate 90% CI Upper Bound Poverty Percent, All Ages 90% CI Lower Bound 90% CI Upper Bound Poverty Estimate 90% CI Lower Bound Poverty Estimate 90% CI Upper Bound Poverty Percent, Age 0-17 90% CI Lower Bound 90% CI Upper Bound Poverty Estimate 90% CI Lower Bound Poverty Estimate 90% CI Upper Bound Poverty Percent, Age 5-17 in Families 90% CI Lower Bound 90% CI Upper Bound Median Household Income 90% CI Lower Bound 90% CI Upper Bound Poverty Estimate 90% CI Lower Bound Poverty Estimate 90% CI Upper Bound Poverty Percent, Age 0-4 90% CI Lower Bound 90% CI Upper Bound
0 US United States 45,878,016 46,428,138 14.7 14.6 14.8 14,862,975 15,137,571 20.7 20.5 20.9 10,145,484 10,344,572 19.5 19.3 19.7 55,775 55,690 55,860 4,397,105 4,499,317 22.8 22.5 23.1
1 AL Alabama 859,781 891,925 18.5 18.2 18.8 280,320 296,580 26.5 25.8 27.2 194,143 208,301 25.2 24.3 26.1 44,833 44,110 45,556 80,530 88,234 29.4 28.1 30.7
2 AK Alaska 71,399 78,483 10.4 9.9 10.9 24,660 28,468 14.5 13.5 15.5 15,367 18,551 13.3 12.1 14.5 73,391 71,522 75,260 7,584 9,486 15.8 14 17.6
4 AZ Arizona 1,136,666 1,181,426 17.4 17.1 17.7 382,324 406,350 24.7 23.9 25.5 263,324 285,216 23.5 22.6 24.4 51,473 51,046 51,900 108,523 117,913 27 25.9 28.1
5 AR Arkansas 528,756 552,710 18.7 18.3 19.1 175,853 188,623 26.4 25.5 27.3 116,955 127,925 24.5 23.4 25.6 42,046 41,574 42,518 53,157 59,241 30.5 28.9 32.1
6 CA California 5,844,717 5,947,793 15.4 15.3 15.5 1,875,284 1,928,686 21.2 20.9 21.5 1,291,425 1,339,151 20.3 19.9 20.7 64,483 64,091 64,875 535,757 559,761 22.3 21.8 22.8
8 CO Colorado 599,548 629,272 11.5 11.2 11.8 175,283 191,149 14.8 14.2 15.4 115,855 129,183 13.6 12.9 14.3 63,945 63,089 64,801 51,075 59,249 16.7 15.5 17.9
9 CT Connecticut 356,084 379,650 10.6 10.3 10.9 104,368 115,918 14.6 13.8 15.4 71,884 81,888 13.6 12.7 14.5 71,333 70,573 72,093 27,471 32,699 16.4 15 17.8
10 DE Delaware 110,138 121,172 12.6 12 13.2 36,088 40,804 19.1 17.9 20.3 24,182 28,216 17.9 16.5 19.3 61,327 60,147 62,507 10,296 12,512 20.7 18.7 22.7
11 DC District of Columbia 107,315 119,055 17.7 16.8 18.6 29,539 36,355 28.3 25.4 31.2 18,455 24,627 29.3 25.1 33.5 73,115 71,082 75,148 9,614 12,170 25.6 22.6 28.6
12 FL Florida 3,091,403 3,166,719 15.8 15.6 16 923,958 964,872 23.4 22.9 23.9 628,795 664,521 22 21.4 22.6 49,416 49,087 49,745 270,976 290,062 26 25.1 26.9
13 GA Georgia 1,680,084 1,731,578 17.2 16.9 17.5 595,487 624,835 24.7 24.1 25.3 414,957 440,693 23.6 22.9 24.3 51,225 50,856 51,594 167,317 180,753 26.9 25.9 27.9
15 HI Hawaii 143,298 154,884 10.7 10.3 11.1 41,234 47,364 14.5 13.5 15.5 26,088 31,242 13.4 12.2 14.6 73,097 71,322 74,872 12,272 15,400 15.4 13.7 17.1
16 ID Idaho 229,473 247,819 14.7 14.1 15.3 71,051 79,061 17.7 16.8 18.6 46,079 52,905 15.9 14.8 17 48,311 47,281 49,341 21,371 25,169 20.9 19.2 22.6
17 IL Illinois 1,676,981 1,727,439 13.6 13.4 13.8 542,782 572,792 19.1 18.6 19.6 369,734 395,974 17.9 17.3 18.5 59,590 59,086 60,094 156,247 171,235 21.3 20.3 22.3
18 IN Indiana 906,481 942,375 14.4 14.1 14.7 303,600 325,372 20.4 19.7 21.1 202,402 221,158 18.8 18 19.6 50,510 50,126 50,894 89,876 100,436 23.2 21.9 24.5
19 IA Iowa 356,824 376,082 12.1 11.8 12.4 101,134 111,250 14.9 14.2 15.6 66,857 75,649 13.7 12.9 14.5 54,843 54,080 55,606 29,049 33,935 16.3 15 17.6
20 KS Kansas 355,837 376,301 12.9 12.5 13.3 114,388 125,600 16.9 16.1 17.7 73,349 83,035 15.3 14.4 16.2 53,802 52,963 54,641 35,759 41,171 19.8 18.4 21.2
21 KY Kentucky 770,810 801,880 18.3 17.9 18.7 242,109 258,251 25.3 24.5 26.1 162,702 176,534 23.8 22.8 24.8 45,178 44,714 45,642 71,385 79,587 27.9 26.4 29.4
22 LA Louisiana 868,463 903,229 19.5 19.1 19.9 300,054 318,320 28.1 27.3 28.9 203,461 218,591 26.7 25.7 27.7 45,829 45,174 46,484 89,832 99,218 30.9 29.4 32.4
23 ME Maine 164,985 177,547 13.2 12.7 13.7 41,123 46,243 17.5 16.5 18.5 27,356 31,740 16 14.8 17.2 51,419 50,597 52,241 10,985 13,407 19.5 17.6 21.4
24 MD Maryland 568,336 598,402 9.9 9.6 10.2 175,556 192,902 13.9 13.2 14.6 114,900 130,312 12.8 12 13.6 75,784 75,203 76,365 51,957 60,405 15.5 14.3 16.7
25 MA Massachusetts 735,323 769,583 11.5 11.2 11.8 195,483 212,095 14.9 14.3 15.5 131,976 146,798 13.9 13.2 14.6 70,659 70,051 71,267 55,255 62,781 16.4 15.4 17.4
26 MI Michigan 1,502,565 1,546,095 15.7 15.5 15.9 469,457 493,385 22.2 21.6 22.8 320,484 341,508 20.8 20.1 21.5 51,063 50,820 51,306 133,216 144,030 24.9 23.9 25.9
27 MN Minnesota 534,759 558,239 10.2 10 10.4 158,109 172,325 13.1 12.5 13.7 103,956 116,230 12.1 11.4 12.8 63,459 62,805 64,113 45,457 52,107 14.2 13.2 15.2
28 MS Mississippi 624,971 652,867 22.1 21.6 22.6 218,077 232,617 31.5 30.5 32.5 151,207 164,227 30.1 28.9 31.3 40,630 40,095 41,165 62,788 68,624 34.6 33.1 36.1
29 MO Missouri 859,879 891,529 14.8 14.5 15.1 268,502 286,872 20.4 19.7 21.1 179,546 195,086 18.9 18.1 19.7 50,200 49,789 50,611 79,490 88,956 23 21.7 24.3
30 MT Montana 139,500 149,768 14.4 13.9 14.9 39,095 43,911 18.8 17.7 19.9 24,749 28,837 16.8 15.5 18.1 49,650 48,370 50,930 12,237 14,627 22.3 20.3 24.3
31 NE Nebraska 217,304 232,088 12.2 11.8 12.6 69,286 77,412 15.9 15 16.8 44,388 51,134 14.4 13.4 15.4 55,073 54,271 55,875 20,845 24,829 17.8 16.2 19.4
32 NV Nevada 412,817 436,831 14.9 14.5 15.3 135,944 148,198 21.6 20.7 22.5 91,511 102,163 20.1 19 21.2 52,544 51,612 53,476 39,339 45,067 24.4 22.7 26.1
33 NH New Hampshire 102,000 114,586 8.4 7.9 8.9 26,213 30,967 11 10.1 11.9 16,995 21,043 9.8 8.8 10.8 70,003 68,837 71,169 7,041 9,191 12.9 11.2 14.6
34 NJ New Jersey 926,421 965,557 10.8 10.6 11 294,809 318,403 15.5 14.9 16.1 201,805 222,751 14.6 13.9 15.3 72,337 71,736 72,938 84,424 94,584 17.3 16.3 18.3
35 NM New Mexico 394,894 415,834 19.8 19.3 20.3 128,356 138,586 27.2 26.2 28.2 86,830 95,958 25.6 24.3 26.9 45,524 44,685 46,363 37,937 42,447 30.3 28.6 32
36 NY New York 2,951,419 3,019,789 15.5 15.3 15.7 902,232 940,792 22.3 21.8 22.8 615,040 648,766 21.3 20.7 21.9 60,805 60,500 61,110 266,296 285,108 23.9 23.1 24.7
37 NC North Carolina 1,584,462 1,630,036 16.4 16.2 16.6 516,088 541,432 23.4 22.8 24 351,428 373,744 21.9 21.2 22.6 47,884 47,370 48,398 150,247 162,559 26.4 25.4 27.4
38 ND North Dakota 74,610 82,616 10.7 10.2 11.2 19,014 22,418 12.1 11.1 13.1 11,027 13,793 10.5 9.3 11.7 61,674 60,168 63,180 6,507 8,367 14.3 12.5 16.1
39 OH Ohio 1,646,455 1,694,519 14.8 14.6 15 532,624 561,312 21.2 20.6 21.8 352,710 378,232 19.3 18.6 20 51,086 50,853 51,319 163,810 176,996 25.1 24.1 26.1
40 OK Oklahoma 597,199 619,815 16 15.7 16.3 200,865 214,213 22 21.3 22.7 132,681 144,163 20.4 19.6 21.2 48,595 48,087 49,103 61,460 67,836 24.7 23.5 25.9
41 OR Oregon 586,548 616,704 15.2 14.8 15.6 159,592 175,052 19.8 18.9 20.7 104,397 117,913 18.1 17 19.2 54,074 53,200 54,948 46,539 53,679 22.4 20.8 24
42 PA Pennsylvania 1,600,900 1,649,082 13.1 12.9 13.3 492,082 519,070 19.1 18.6 19.6 333,412 356,680 17.9 17.3 18.5 55,683 55,309 56,057 140,774 153,090 21 20.1 21.9
44 RI Rhode Island 137,706 149,742 14.1 13.5 14.7 40,672 45,442 20.6 19.5 21.7 27,680 31,810 19.3 18 20.6 57,265 55,361 59,169 11,347 13,647 23.1 21 25.2
45 SC South Carolina 779,482 813,736 16.8 16.4 17.2 252,384 268,908 24.4 23.6 25.2 176,953 191,475 23.5 22.6 24.4 47,308 46,768 47,848 69,621 77,219 26.1 24.8 27.4
46 SD South Dakota 106,789 116,605 13.5 12.9 14.1 34,389 38,779 17.7 16.6 18.8 21,422 25,102 16 14.7 17.3 53,263 52,229 54,297 11,145 13,333 20.5 18.7 22.3
47 TN Tennessee 1,057,666 1,098,066 16.7 16.4 17 345,281 366,079 24.1 23.4 24.8 231,264 249,468 22.4 21.6 23.2 47,243 46,760 47,726 103,671 113,893 27.7 26.4 29
48 TX Texas 4,207,517 4,303,863 15.9 15.7 16.1 1,603,378 1,664,920 22.9 22.5 23.3 1,099,292 1,152,092 21.9 21.4 22.4 55,668 55,355 55,981 469,430 499,426 24.8 24 25.6
49 UT Utah 320,622 341,844 11.2 10.8 11.6 108,996 122,026 12.8 12.1 13.5 69,122 80,430 11.5 10.6 12.4 62,961 61,825 64,097 33,548 40,062 14.9 13.6 16.2
50 VT Vermont 59,418 65,868 10.4 9.9 10.9 14,648 17,370 13.7 12.5 14.9 9,326 11,704 12.2 10.8 13.6 56,883 55,668 58,098 3,928 5,194 15.6 13.4 17.8
51 VA Virginia 895,213 933,239 11.2 11 11.4 266,171 285,323 15 14.5 15.5 178,578 194,628 14 13.4 14.6 66,263 65,730 66,796 77,957 87,565 16.4 15.4 17.4
53 WA Washington 842,651 878,817 12.2 11.9 12.5 238,353 258,413 15.7 15.1 16.3 156,493 174,495 14.6 13.8 15.4 64,080 63,310 64,850 68,970 77,940 16.8 15.8 17.8
54 WV West Virginia 313,401 331,777 18 17.5 18.5 88,004 95,920 24.7 23.6 25.8 57,935 64,721 22.9 21.6 24.2 41,969 41,200 42,738 26,605 30,499 28.2 26.3 30.1
55 WI Wisconsin 666,924 692,950 12.1 11.9 12.3 201,745 217,019 16.5 15.9 17.1 132,050 145,102 14.9 14.2 15.6 55,623 55,199 56,047 60,183 67,673 19.1 18 20.2
56 WY Wyoming 56,709 64,865 10.6 9.9 11.3 16,068 19,382 13 11.8 14.2 9,642 12,422 11.2 9.8 12.6 61,213 59,768 62,658 5,136 6,818 15.8 13.6 18
Step by Step Solution
There are 3 Steps involved in it
Step: 1

Get Instant Access to Expert-Tailored Solutions
See step-by-step solutions with expert insights and AI powered tools for academic success
Step: 2

Step: 3
Ace Your Homework with AI
Get the answers you need in no time with our AI-driven, step-by-step assistance
Get Started
Elementary Linear Algebra with Applications
Authors: Bernard Kolman, David Hill
9th edition
132296543, 978-0132296540