

Question
Getting error in code ## Insert your code BEGIN # Define any variables or methods that you need here import numpy as np import matplotlib.pyplot
Getting error in code
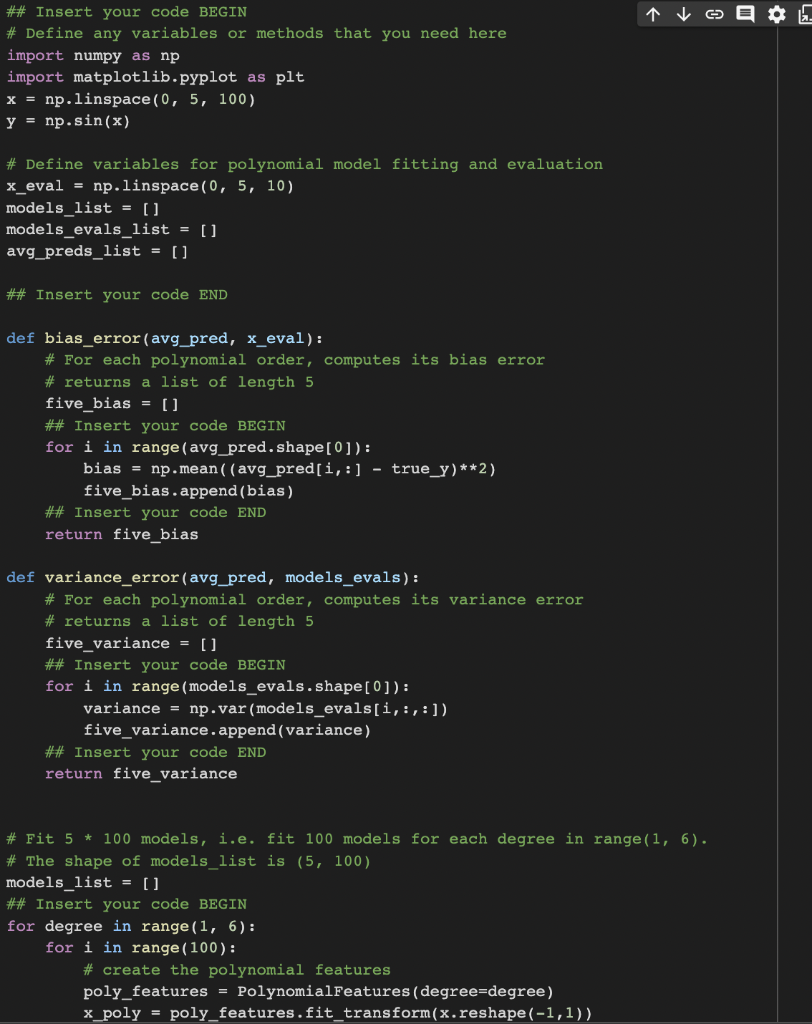
## Insert your code BEGIN
# Define any variables or methods that you need here
import numpy as np
import matplotlib.pyplot as plt
x = np.linspace(0, 5, 100)
y = np.sin(x)
# Define variables for polynomial model fitting and evaluation
x_eval = np.linspace(0, 5, 10)
models_list = []
models_evals_list = []
avg_preds_list = []
## Insert your code END
def bias_error(avg_pred, x_eval):
# For each polynomial order, computes its bias error
# returns a list of length 5
five_bias = []
## Insert your code BEGIN
for i in range(avg_pred.shape[0]):
bias = np.mean((avg_pred[i,:] - true_y)**2)
five_bias.append(bias)
## Insert your code END
return five_bias
def variance_error(avg_pred, models_evals):
# For each polynomial order, computes its variance error
# returns a list of length 5
five_variance = []
## Insert your code BEGIN
for i in range(models_evals.shape[0]):
variance = np.var(models_evals[i,:,:])
five_variance.append(variance)
## Insert your code END
return five_variance
# Fit 5 * 100 models, i.e. fit 100 models for each degree in range(1, 6).
# The shape of models_list is (5, 100)
models_list = []
## Insert your code BEGIN
for degree in range(1, 6):
for i in range(100):
# create the polynomial features
poly_features = PolynomialFeatures(degree=degree)
x_poly = poly_features.fit_transform(x.reshape(-1,1))
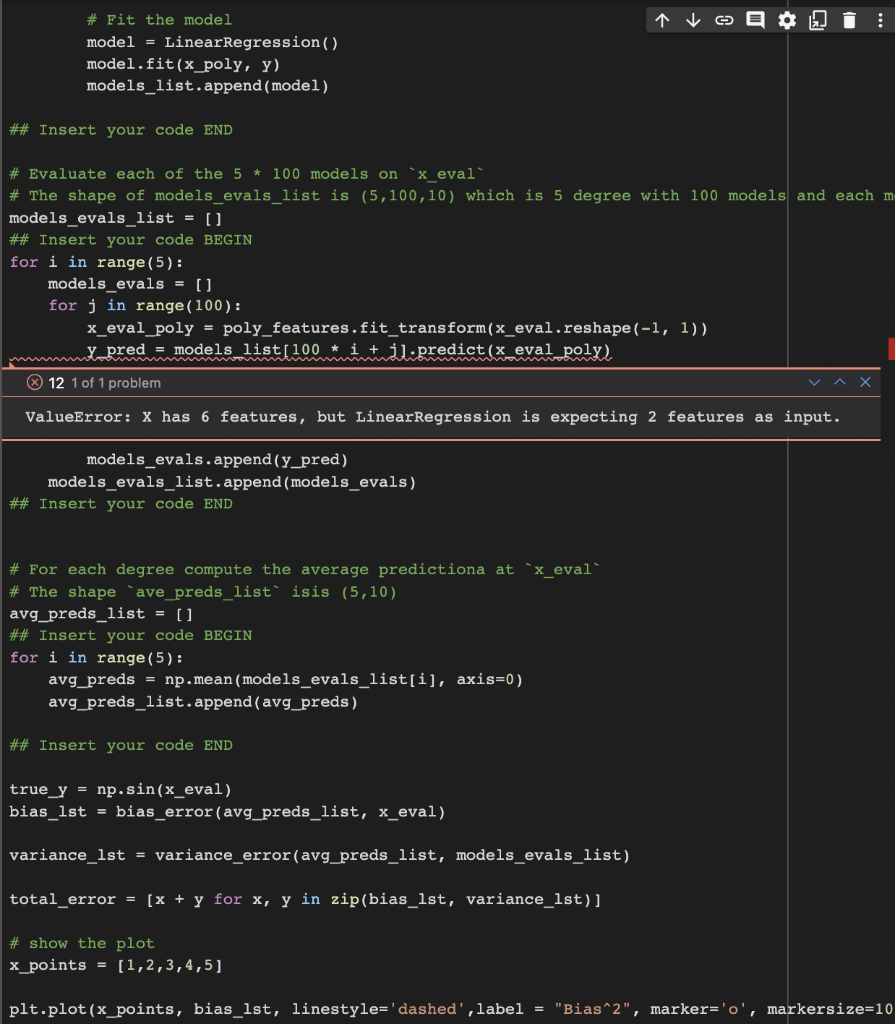
# Fit the model
model = LinearRegression()
model.fit(x_poly, y)
models_list.append(model)
## Insert your code END
# Evaluate each of the 5 * 100 models on `x_eval`
# The shape of models_evals_list is (5,100,10) which is 5 degree with 100 models and each model predict the 10 x evaluation
models_evals_list = []
## Insert your code BEGIN
for i in range(5):
models_evals = []
for j in range(100):
x_eval_poly = poly_features.fit_transform(x_eval.reshape(-1, 1))
y_pred = models_list[100 * i + j].predict(x_eval_poly)
models_evals.append(y_pred)
models_evals_list.append(models_evals)
## Insert your code END
# For each degree compute the average predictiona at `x_eval`
# The shape `ave_preds_list` isis (5,10)
avg_preds_list = []
## Insert your code BEGIN
for i in range(5):
avg_preds = np.mean(models_evals_list[i], axis=0)
avg_preds_list.append(avg_preds)
## Insert your code END
true_y = np.sin(x_eval)
bias_lst = bias_error(avg_preds_list, x_eval)
variance_lst = variance_error(avg_preds_list, models_evals_list)
total_error = [x + y for x, y in zip(bias_lst, variance_lst)]
# show the plot
x_points = [1,2,3,4,5]
plt.plot(x_points, bias_lst, linestyle='dashed',label = "Bias^2", marker='o', markersize=10)
plt.plot(x_points, variance_lst, linestyle='dashed', label = "Variance", marker='o', markersize=10)
plt.plot(x_points, total_error, linestyle='solid', label = "Error", marker='o', markersize=10)
plt.legend()
plt.xlim(0.9, 5.1)
plt.xticks(np.linspace(1, 5, 5))
plt.xlabel("Order")
plt.ylabel("Error")
plt.title("Bias and Variance Trade-off")
# Display graph
plt.show()
Step by Step Solution
There are 3 Steps involved in it
Step: 1

Get Instant Access to Expert-Tailored Solutions
See step-by-step solutions with expert insights and AI powered tools for academic success
Step: 2

Step: 3
Ace Your Homework with AI
Get the answers you need in no time with our AI-driven, step-by-step assistance
Get Started
Advanced MySQL 8 Discover The Full Potential Of MySQL And Ensure High Performance Of Your Database
Authors: Eric Vanier ,Birju Shah ,Tejaswi Malepati
1st Edition
1788834445, 978-1788834445