Answered step by step
Verified Expert Solution
Question
1 Approved Answer
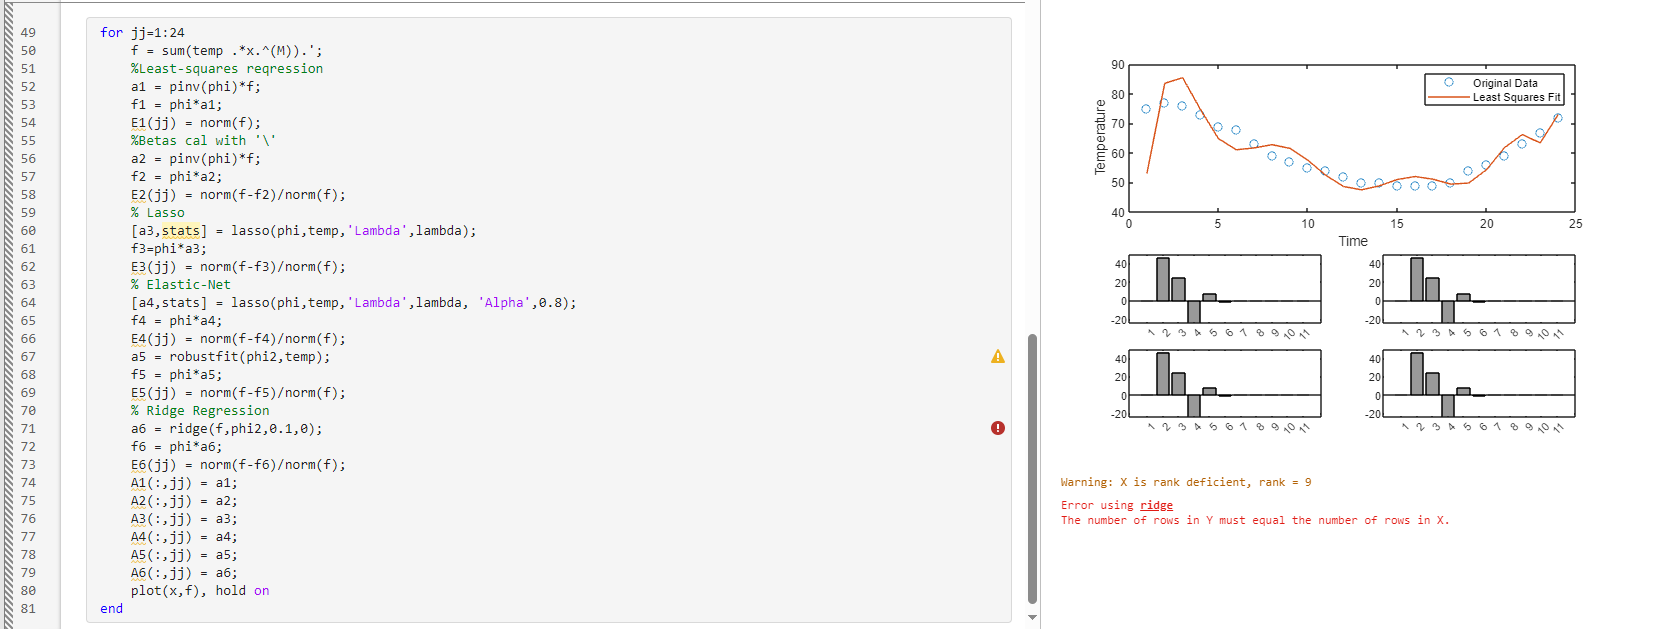
Getting error message related to Ridge in MATLAB, see code below % Temperature data temp =[75,77,76,73,69,68,63,59,57,55,54,52,50,50,49,49,49,50,54,56,59,63,67,72]; % Time time =1:24; % Query the polynomial fit
Getting error message related to Ridge in MATLAB, see code below
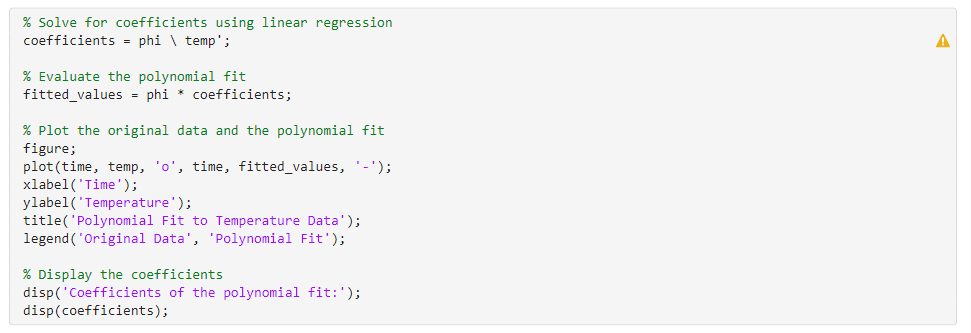
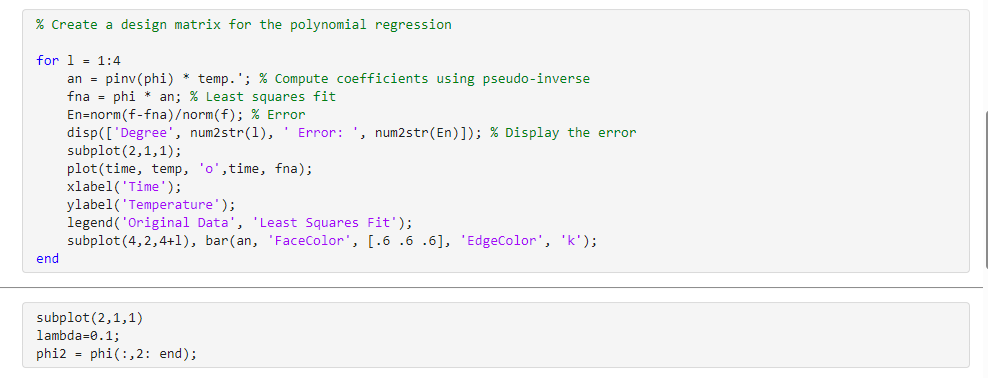
\% Temperature data temp =[75,77,76,73,69,68,63,59,57,55,54,52,50,50,49,49,49,50,54,56,59,63,67,72]; % Time time =1:24; \% Query the polynomial fit x= linspace (1,24,24);% Time vector M=10;% Polynomial Degree f=sum( temp x(M)); phi = zeros(length(time), M); for j=1:M phi (:,j+1)=xj; end \% Solve for coefficients using linear regression coefficients = phi \ temp'; \% Evaluate the polynomial fit fitted_values = phi * coefficients; \% Plot the original data and the polynomial fit figure; plot(time, temp, 'o', time, fitted_values, '-'); xlabel('Time'); ylabel('Temperature'); title('Polynomial Fit to Temperature Data'); legend('Original Data', 'Polynomial Fit'); \% Display the coefficients disp('Coefficients of the polynomial fit:'); disp(coefficients); % Create a design matrix for the polynomial regression for 1=1:4 an = pinv(phi) * temp.'; \% Compute coefficients using pseudo-inverse fna = phi an; \% Least squares fit En=norm(f-fna)orm(f); \% Error disp(['Degree', num2str(1), 'Error: ', num2str(En)]); \% Display the error subplot (2,1,1); plot(time, temp, 'o', time, fna); xlabel('Time'); ylabel('Temperature'); legend('Original Data', 'Least Squares Fit'); end subplot (2,1,1) lambda =0.1; phi2 =phi(:,2: end ); for jj=1:24 f=sum( temp x(M)); \%Least-squares reqression a1=pinv( phi )f; f1 = phi*a1; E1(jj)=norm(f); \%Betas cal with ' \ ' a2 =pinv(phi)f; f2 = phi*a2; E2(jj)=norm(ff2)orm(f); % Lasso [a3,stats] = lasso (phi,temp, 'Lambda', lambda); f3=phi*a3; E3(jj)=norm(ff3)orm(f); \% Elastic-Net [a4,stats] = lasso(phi,temp, 'Lambda', lambda, 'Alpha', , 0.8); f4= phi*a4; E4(jj)=norm(ff4)orm(f); a5 = robustfit(phi2, temp); f5 = phi*a5; E5(jj)=norm(ff5)orm(f); \% Ridge Regression a6 = ridge (f, phi2,0.1, 0); f6 = phi*a6; E6(jj)=norm(ff6)orm(f); A1(:,jj)=a1; A2(:,jj)=a2; A3(:,jj)=a3; A4(:,jj)=a4; A5(:,jj)=a5; A6(:,jj)=a6; plot (x,f), hold on end Warning: X is rank deficient, rank =9 Error using ridge The number of rows in Y must equal the number of rows in XStep by Step Solution
There are 3 Steps involved in it
Step: 1
Get Instant Access to Expert-Tailored Solutions
See step-by-step solutions with expert insights and AI powered tools for academic success
Step: 2
Step: 3
Ace Your Homework with AI
Get the answers you need in no time with our AI-driven, step-by-step assistance
Get Started