Give as much information as possible. Thanks
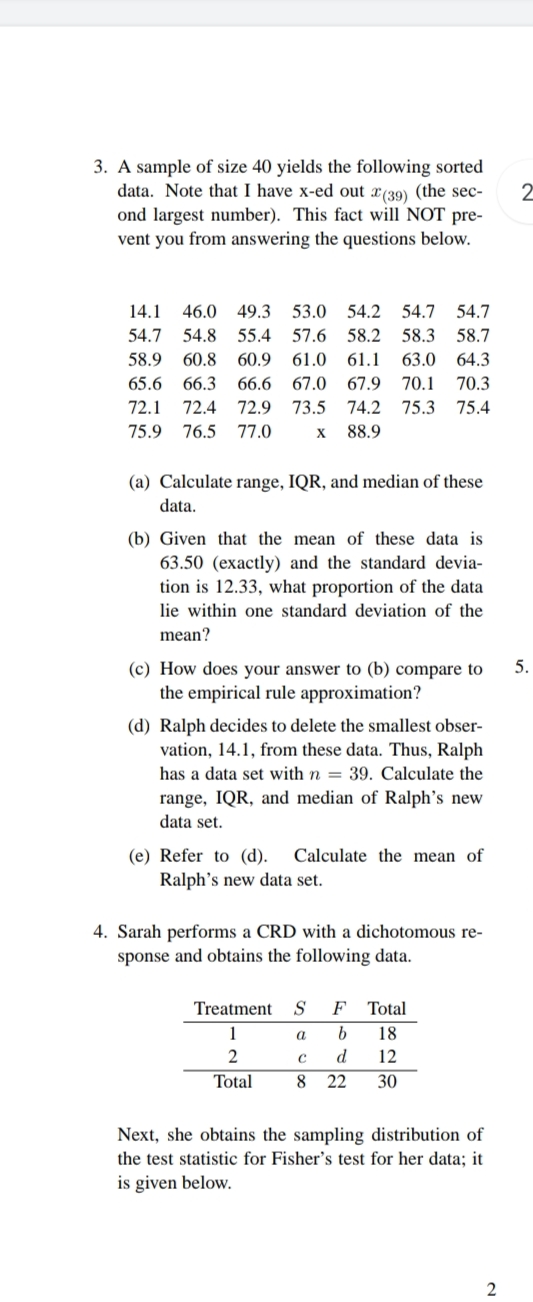
3. A sample of size 40 yields the following sorted data. Note that I have x-ed out I(39) (the sec- ond largest number). This fact will NOT pre- vent you from answering the questions below. 14.1 46.0 49.3 53.0 54.2 54.7 54.7 54.7 54.8 55.4 57.6 58.2 58.3 58.7 58.9 60.8 60.9 61.0 61.1 63.0 64.3 65.6 66.3 66.6 67.0 67.9 70.1 70.3 72.1 72.4 72.9 73.5 74.2 75.3 75.4 75.9 76.5 77.0 x 88.9 (a) Calculate range, IQR, and median of these data. (b) Given that the mean of these data is 63.50 (exactly) and the standard devia- tion is 12.33, what proportion of the data lie within one standard deviation of the mean? (c) How does your answer to (b) compare to 5. the empirical rule approximation? (d) Ralph decides to delete the smallest obser vation, 14.1, from these data. Thus, Ralph has a data set with n = 39. Calculate the range, IQR, and median of Ralph's new data set. (e) Refer to (d). Calculate the mean of Ralph's new data set. 4. Sarah performs a CRD with a dichotomous re- sponse and obtains the following data. Treatment S F Total a b 18 2 C d 12 Total 8 22 30 Next, she obtains the sampling distribution of the test statistic for Fisher's test for her data; it is given below. 2x P(X = x) P(X
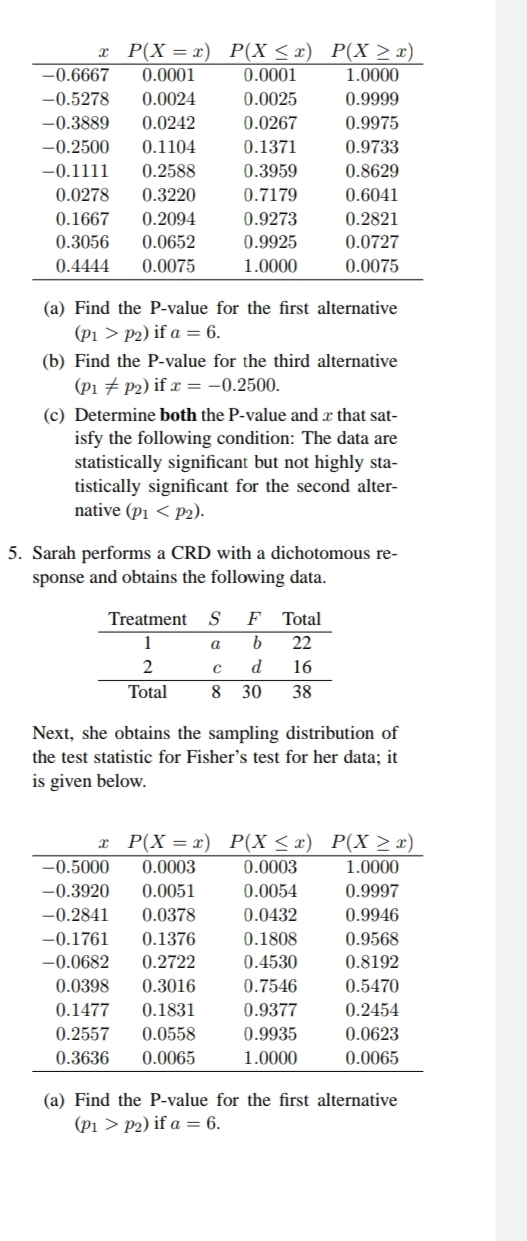
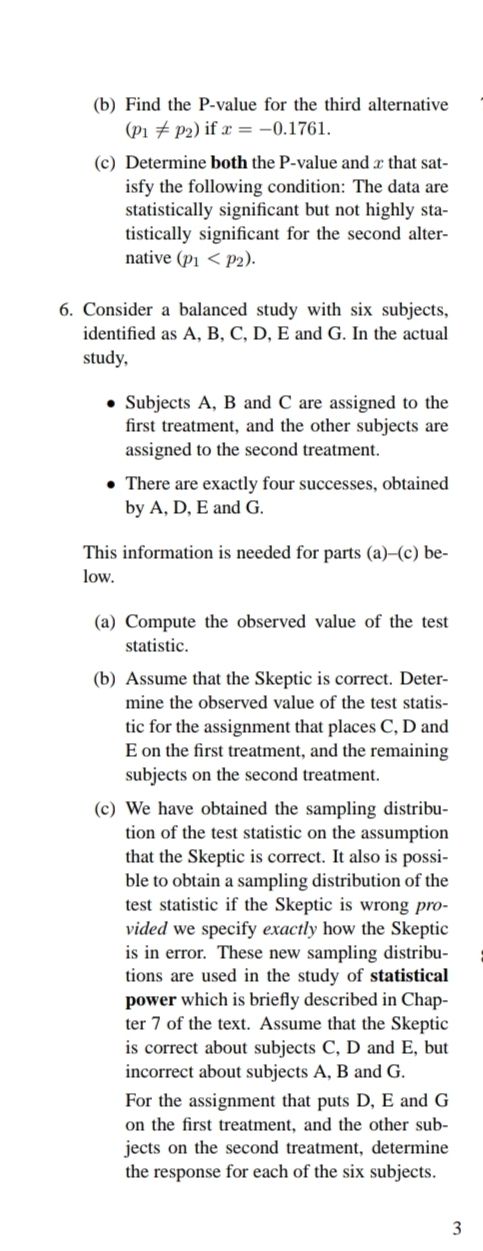
>) -0.6667 0.0001 0.0001 1.0000 -0.5278 0.0024 0.0025 0.9999 -0.3889 0.0242 0.0267 0.9975 -0.2500 0.1104 0.1371 0.9733 -0.1111 0.2588 0.3959 0.8629 0.0278 0.3220 0.7179 0.6041 0.1667 0.2094 0.9273 0.2821 0.3056 0.0652 0.9925 0.0727 0.4444 0.0075 1.0000 0.0075 (a) Find the P-value for the first alternative (P1 > p2) if a = 6. (b) Find the P-value for the third alternative (p1 # p2) if x = -0.2500. (c) Determine both the P-value and a that sat- isfy the following condition: The data are statistically significant but not highly sta- tistically significant for the second alter- native (p1 >) -0.5000 0.0003 0.0003 1.0000 -0.3920 0.0051 0.0054 0.9997 -0.2841 0.0378 0.0432 0.9946 -0.1761 0.1376 0.1808 0.9568 -0.0682 0.2722 0.4530 0.8192 0.0398 0.3016 0.7546 0.5470 0.1477 0.1831 0.9377 0.2454 0.2557 0.0558 0.9935 0.0623 0.3636 0.0065 1.0000 0.0065 (a) Find the P-value for the first alternative (P1 > p2) if a = 6.(in) Find the Pvalue for the third alternative (p: 76 92) if:.-: = 43.1761. (c) Determine both the P-value and .1: that sat- isfy the following condition: The data are statistically signicant but not highly sta- tistically signicant for the second alter- native (p1 a: m}. 6. Consider a balanced study with six subjects, identied as A, B, C, D. E and G. In the actual study, 0 Subjects A, B and C are assigned to the rst treatment, and the other subjects are assigned to the second treatment. 0 There are exactly four successes, obtained by A. D. E and G. This information is needed for parts (a)(c) be- low. (a) Compute the observed value of the test statistic. (b) Assume that the Skeptic is correct. Deter- mine the observed value of the test statis- tic for the assignment that places C. D and E on the rst treatment, and the remaining subjects on the second treatment. to) We have obtained the sampling distribu- tion of the test statistic on the assumption that the Skeptic is correct. It also is possi- ble to obtain a sampling distribution of the test statistic if the Skeptic is wrong pro- vided we specify exactly how the Skeptic is in error. These new sampling distribu- tions are used in the study of statistical power which is briey described in Chap- ter \".l of the text. Assume that the Skeptic is correct about subjects C. D and E. but incorrect about subjects A, B and G. For the assignment that puts D. E and G on the rst treatment, and the other sub- jects on the second treatment, determine the response for each of the six subjects


