Answered step by step
Verified Expert Solution
Question
1 Approved Answer
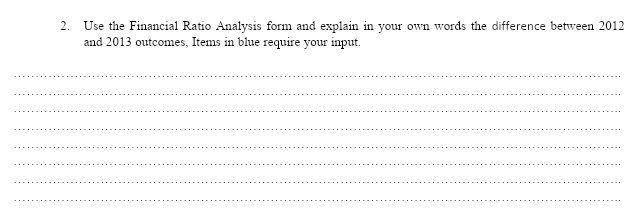
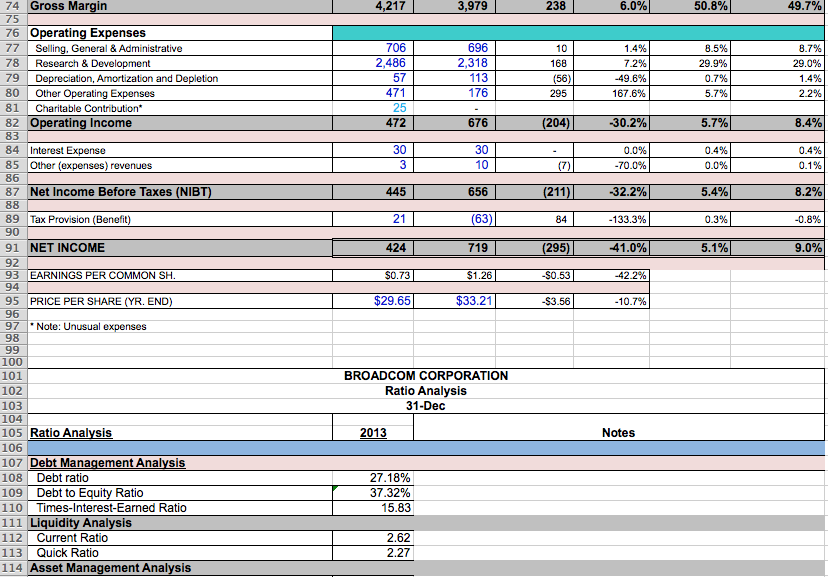
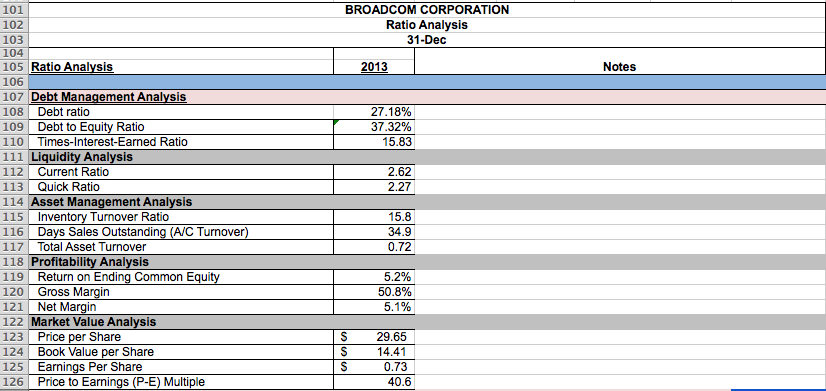
Give me the difference between 2012 and 2013 and help me in a good answer 2. Use the Financial Ratio Analysis form and explain in
Give me the difference between 2012 and 2013 and help me in a good answer
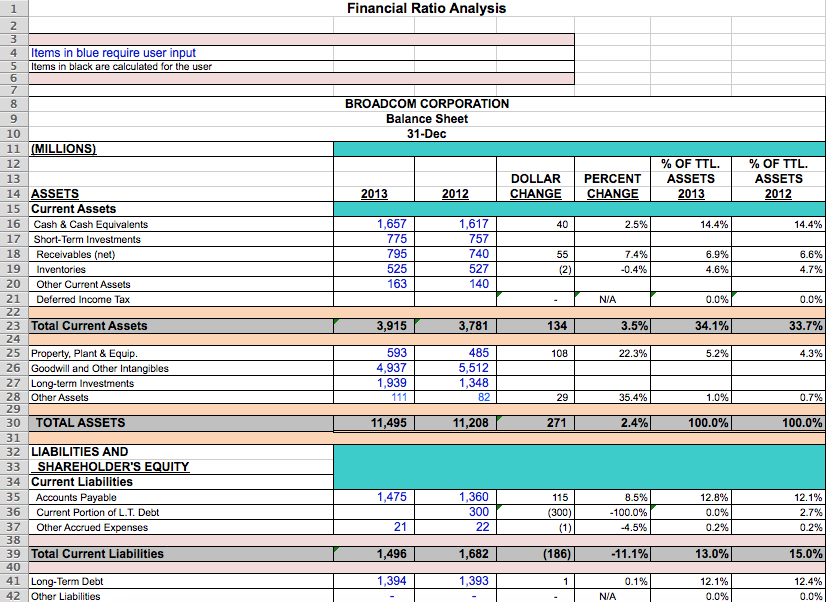
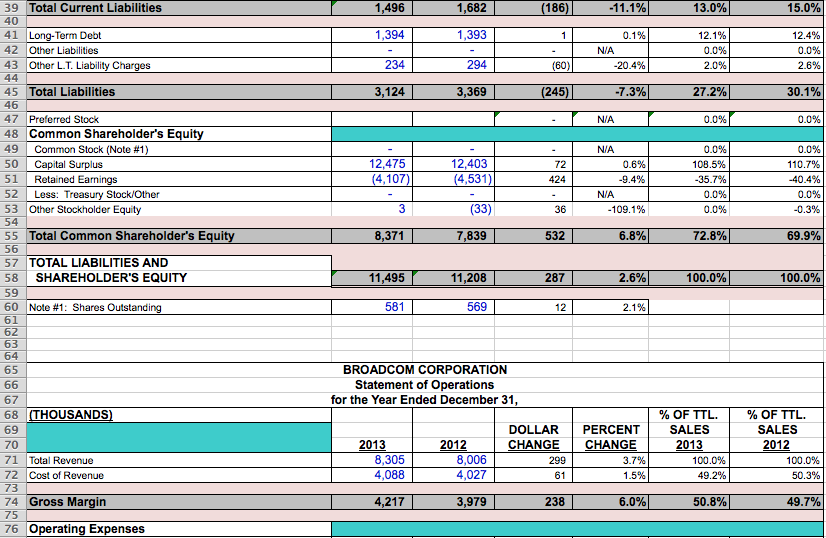
2. Use the Financial Ratio Analysis form and explain in your own words the difference between 2012 and 2013 outcomes, Items in blue require your input. 1 Financial Ratio Analysis 2 3 4 5 6 7 8 Items in blue require user input Items in black are calculated for the user BROADCOM CORPORATION Balance Sheet 31-Dec DOLLAR CHANGE PERCENT CHANGE % OF TTL. ASSETS 2013 % OF TTL. ASSETS 2012 2013 2012 40 2.5% 14.4% 14.4% 17 1,657 775 795 525 163 1,617 757 740 527 140 7.4% 55 (2) 6.9% 4.6% 6.6% 4.7% -0.4% NIA 0.0% 0.0% 3,915 3,781 134 3.5% 34.1% 33.7% 108 22.3% 5.2% 9 10 11 (MILLIONS) 12 13 14 ASSETS 15 Current Assets 16 Cash & Cash Equivalents Short-Term Investments 18 Receivables (not) 19 Inventories 20 Other Current Assets 21 Deferred Income Tax 22 23 Total Current Assets 24 25 Property, Plant & Equip. 26 Goodwill and Other Intangibles 27 Long-term Investments 28 Other Assets 29 30 TOTAL ASSETS 31 32 LIABILITIES AND 33 SHAREHOLDER'S EQUITY 34 Current Liabilities 35 Accounts Payable 36 Current Portion of L.T. Debt 37 Other Accrued Expenses 38 39 Total Current Liabilities 40 41 Long-Term Debt 42 Other Liabilities 4.3% 593 4,937 1,939 111 485 5,512 1,348 82 29 35.4% 1.0% 0.7% 11,495 11,208 271 2.4% 100.0% 100.0% 1,475 1,360 300 22 115 (300) (1) 8.5% -100.0% -4.5% 12.8% 0.0% 0.2% 12.1% 2.7% 0.2% 21 1,496 1,682 (186) - 11.1% 13.0% 15.0% 1,394 1,393 1 0.1% 12.1% 0.0% 12.4% 0.0% N/A 1,496 1,682 (186) -11.1% 13.0% 15.0% 1,394 1,393 1 0.1% NIA -20.4% 12.1% 0.0% 2.0% 12.4% 0.0% 2.6% 234 294 (60) 3,124 3,369 (245) -7.3% 27.2% 30.1% N/A 0.0% 0.0% 12,475 (4,107) 12,403 (4,531) 72 424 39 Total Current Liabilities 40 41 Long-Term Debt 42 Other Liabilities 43 Other L.T. Liability Charges 44 45 Total Liabilities 46 47 Proferred Stock 48 Common Shareholder's Equity 49 Common Stock (Note #1) 50 Capital Surplus 51 Retained Earnings 52 Less: Treasury Stock/Other 53 Other Stockholder Equity 54 55 Total Common Shareholder's Equity 56 57 TOTAL LIABILITIES AND 58 SHAREHOLDER'S EQUITY 59 60 Note #1: Shares Outstanding 61 62 63 64 65 66 67 68 (THOUSANDS) N/A 0.6% -9.4% N/A -109.1% 0.0% 108.5% -35.7% 0.0% 0.0% 0.0% 110.7% -40.4% 0.0% -0.3% 3 (33) 36 8,371 7,839 532 6.8% 72.8% 69.9% 11,495 11,208 287 2.6% 100.0% 100.0% 581 569 12 2.1% BROADCOM CORPORATION Statement of Operations for the Year Ended December 31, 69 2013 8,305 4,088 2012 8,006 4,027 DOLLAR CHANGE 299 61 PERCENT CHANGE 3.7% 1.5% % OF TTL. SALES 2013 100.0% 49.2% % OF TTL. SALES 2012 100.0% 50.3% 70 71 Total Revenue 72 Cost of Revenue 73 74 Gross Margin 75 76 Operating Expenses 4,217 3,979 238 6.0% 50.8% 49.7% 4,217 3,979 238 6.0% 50.8% 49.7% 706 2,486 57 471 25 472 696 2,318 113 176 10 168 (56) 295 1.4% 7.2% -49.6% 167.6% 8.5% 29.9% 0.7% 5.7% 3.7% 29.0% 1.4% 2.2% 676 (204) -30.2% 5.7% 8.4% 30 3 30 10 0.0% -70.0% 0.4% 0.0% 0.4% 0.1% (7) 445 656 (211) -32.2% 5.4% 8.2% 21 (63) 84 -133.3% 0.3% -0.8% 424 719 (295) 41.0% 5.1% 9.0% $0.73 $1.26 -$0.53 -42.2% 74 Gross Margin 75 76 Operating Expenses 77 Selling, General & Administrative 78 Research & Development 79 Depreciation, Amortization and Depletion 80 Other Operating Expenses 81 Charitable Contribution* 82 Operating Income 83 84 Interest Expense 85 Other (expenses) revenues 86 87 Net Income Before Taxes (NIBT) 88 89 Tax Provision (Benefit) 90 91 NET INCOME 92 93 EARNINGS PER COMMON SH. 94 95 PRICE PER SHARE (YR. END) 96 97 * Note: Unusual expenses 98 99 100 101 102 103 104 105 Ratio Analysis 106 107 Debt Management Analysis 108 Debt ratio 109 Debt to Equity Ratio 110 Times-Interest-Earned Ratio 111 Liquidity Analysis 112 Current Ratio 113 Quick Ratio 114 Asset Management Analysis $29.65 $33.21 -$3.56 -10.7% BROADCOM CORPORATION Ratio Analysis 31-Dec 2013 Notes 27.18% 37.32% 15.83 2.62 2.27 BROADCOM CORPORATION Ratio Analysis 31-Dec 2013 Notes 27.18% 37.32% 15.83 2.62 2.27 101 102 103 104 105 Ratio Analysis 106 107 Debt Management Analysis 108 Debt ratio 109 Debt to Equity Ratio 110 Times-Interest-Earned Ratio 111 Liquidity Analysis 112 Current Ratio 113 Quick Ratio 114 Asset Management Analysis 115 Inventory Turnover Ratio 116 Days Sales Outstanding (A/C Turnover) 117 Total Asset Turnover 118 Profitability Analysis 119 Return on Ending Common Equity 120 Gross Margin 121 Net Margin 122 Market Value Analysis 123 Price per Share 124 Book Value per Share 125 Earnings Per Share 126 Price to Earnings (P-E) Multiple 15.8 34.9 0.72 5.2% 50.8% 5.1% S S S 29.65 14.41 0.73 40.6Step by Step Solution
There are 3 Steps involved in it
Step: 1

Get Instant Access to Expert-Tailored Solutions
See step-by-step solutions with expert insights and AI powered tools for academic success
Step: 2

Step: 3

Ace Your Homework with AI
Get the answers you need in no time with our AI-driven, step-by-step assistance
Get Started


