

Answered step by step
Verified Expert Solution
Question
1 Approved Answer
give s ummary of this article. what are insights does this give you about beta? why do you think of other dactors that could affect
give s ummary of this article.
Bad Beta, Good Beta This paper explains the size and value "anomalies" in stock retums using an ecenomically motivated rwo-beta model. We break the beta of a srock wish the market portfolio into two components, one reftecting news abour the market's futare cash flows and one reflecting news about the market's discount nates. Intertemponal asset pricing theory suggests that the former should have a higher price of rixk:, thaes beta, like cholesterol, cames in "bad" and "good" varieties. Empirically, we find that value stocks and small stocks have considenably higher cash flow betas tham groweth slocks and large stock, and this can explain their higher average returns. The poor performance of the cupital asset pricing model (CAPM) since 1963 is explained by the fact that eFrowth stocks and high-past-beta stocks have predounnandly good belas with low risk prices, (JEL. G12, G14, N22) How should a rational investor measure the particular, small stocks and value stocks have risks of stock market investments? What deter- delivered bigher average returns than their betas mines the risk premium that will induce a rav- can justify. Adding insult to injury, stocks with tional investor to hold an individual stock at its high past betas have had average retums no market weight, rather than overweighting of higher than stocks of the same size with low underweighting it? According to the CAPM of past betas. These findings tempt investors to tilt William Sharpe (1964) and John Lintner their stock portfolios systematically toward (1965), a stock's risk is summarized by its beta small stocks, value stocks, and stocks with low with the market portfolio of all invested wealth. past betas.. Controlling for beta, no other characteristics of We argue that returns on the market poetfolio a stock should influence the return required by a have two components, and that recognizing the rational investor. difference between these two components can It is well known that the CAPM fails to eliminate the incentive to overweight value. describe average realized stock returns since the small, and low-beta stocks. The value of the early 1960 s, if a value-weighted equity index is market portfolio may fall because investors reused as a proxy for the tarket portfolio. In ceive bad news about fature cash flows, bat it may also fall because investors increase the discount rate of cost of capital that they apply to - Camphell: Deparument of Eeonomice. Litaber Cener, these cash flowk. In the first case, wealth deHarvaed University, Cambridge, MA 0215s, and Natichal creases and investment opportanities are untauer Center, Harvand Univerify. Cambndge, MA O2138, decreases but future investment opportunities and NEIRR (e-maik t_ruolicenaboe hariardedul. We improve. would like to thank Ben Biertanke, Michael Brennan, Jo. seph Chen, Randy Cohen, Robert Hodrick. Mami Keloharju, Owen Latmont, Greg Mankiw, Labos Pavor, Antit Peajisa, ees, and seminar partikiparas at various venuse for helpfil Graham and David Dodd (1934 . Sarjoy Basu (t977, 1963). with some of the data used in ths stady. All enors and. value eflect. Lagene Fand and Keancth french (1992) gine benssions rensain our responsibility. This material in bused an inflential trtatment of both effects within an integrated upoo work supported by the National Scicece Fonadation framezork and shos that soring siock on past maked inder Gain No. 0214061 to Campleil. betas grocrales liele variation is average returs: 1244 These two components showld have different reason for this is that growth stocks, with low: signifacance for a risk-averse, long-term inves. average returns, have high hetas with the market tor who holds the market portfolio. Such an portfolio; but their high betas are predorminantly investor may demand a higher premium to bold good betas, with low risk prices. Valae stocks. assets that covary with the market's cash-llow with high average retarns, have higher had betas news than to bold assets that covary with news than crowth stocks do. The two-beta model alho about the market's discount rates, for poor re- explains why stocks with hight fast CAPM betas turns driven by increases in discotant rales are bave offered relatively little extra retum: these partially conpensated by improved prospects stocks have higher food hetas but almost the for futare returns. To measare risk for this in- same bad betas as other stocks. Since the good vestor properly, the single beta of the Sharpe- beta carries only a low premitam, the almont flat Lintner CAPM should be broken into two relation between average returms and the CAPM different betas a cash-flow beta and ar discount- beta is no purrle to the two-beta model. In the rate beta. We expect a rational investor who is early period, lanuary 1929 to lune 1963 , we holding the market portfolio to demand a find that the ratio of good to bad beta is relagreater reward for bearing the former type of tively constant across the assets ae cansiber, so risk than the latter. In fact, an intertemporal the single-beta CAPM adequately explains the capital asset pricing model (ICAPM) of the sont data. proposed by Robent Merton (1973) suggests Our model explains why stocks with high that the price of risk for the discount-rate beta cash-flow betas may offer high average returns, should equal the variance of the market return, given that long-term investors are fully invested while the price of risk for the cash-flow beta in equities at all times, or, in a slight gencraliwhould be y times greater, where is the inves. zation of the model, maintain a constant allocator's cocfficient of relative risk aversion. Thus, tion to equities, Our model does not explain if the investor is conservative in the sense that why long-term investors woald wish to kecp >1, the cash-fow beta bas a higher price of their equaty allocations constant. if the equaity risk. prenium is time-varying, it is optimal foe a An intuitive way to summarize oar story is to long-term investoe with a fixed coefficient of say that beta, like cholesterol, has a "bad" va- relative risk aversion to invest moce in equatics riety and a "good" variety. Just as a perwoe's at times when the cquity premam is high heart-attack risk is determined not by his overall (Campbell and Luts Viccira. 1999, Tong. Suk. cholecterol level bat peimarily by his bad cho- Kim and Edward Oanberg. 1996). We could lesterol level with a secopdary influence from generaline the model to allow a time-sarying good cholesterol, so the risk of a stock for a equity weight in the investor's portfolio, but this long-term investor is determined not by the wotuld not be consistent with general equilabstock's overall beta with the market but by its ritm if all investors have the same preferences. bad eash-flow beta with a secondary influence Thus-our model cannot be interpreted as a from its good discount-rate beta. Of courve, the representative-agent general-cquilabrium model good beta is good not in absolute terms bat in of the econormy. Our achievement is menely to relation to the other type of beta. show that the risks of value, small, and lowWe test these ideas by fitting a two-beta pac-beta socks are sufficient to deter inve4ICAPM to historical moathly returns on stock ment ia these socks by conservative loag-termu portfolios sorted by size, book-to-market ratios, isvestors who eschew market timing. 2 and market betas. We consider not only a sample period since 1963 that has been the subject sample period 19291963 using the data of sine and value effosts. The Autvurape hisief Theory (APT) James Davis et al. (2000). In the modern period, of Stephea Rom (1976) allown any perave neace at July 1963 to December 2001 . we find that the comme variatine is be a priced nik factere lase and twoubeta model greatly improyes the poot per- Fickin (1993) introdase an influential troe-faciar madd an In developing and testing the two-beta and the other factors are shocks to variables that ICAPM. we draw on a great deal of related predict the market return. literature. The idea that the market's retum can The two recent empirical papers that are closbe attributed to cash-flosy and discount-fate est to oars in their focas afe by Michacl J. news is not novel. Campbell and Robert Shiller Brennan et al. (2004) and Joseph Chen (2003). (1988a) develop a loglinear approximate frame- Brennan et al. model the riskless interest rate work in which to study the effects of changing and the Sharpe ratio oe the market portfolio ats cash-flow and discount-fate forecasts on siock continuous-time AR(1) processes. They catiprices. Campbell (1991) uses this framework. mate the parameters of theif model using bond and a vector aatoregressive (VAR) model to market data and explore the model's implicadecompose market returns into cash-llow news tions for the value and size effects in U.S. and discoent-rate news, Empirically, he finds equities since 1953, with soene success, Chen that discount-rate news is far from negligible; in (2003) exiends the framework of Camphell postwar U.S. data. for example, his VAR sys-. (1993) to allow for heteroskedastic asset retem explains most stock-return volatility as the tams, but given the state variables he includes result of discount-rate news. is his model, he finds little evidence that growth The insight that long-term investors care stocks are valuable hedges against shocks to about shocks to investment opportunities is due investment opportunitics. to Merton (1973). Campbell (1993) solves a A key to our success in explaining a number diserete-time empirical version of Merton's of asset pricing anomalies is our use of the ICAPM, assaming that asset returns are ho- sinall-stock value spread to predict aggregate moskedastic and that a representative invessor stock returns. Recently, several authors have has the recursive preferences proposed by law- found that high returms to growth stocks, particrence Epstein and Stanley Zin (1989,1991). ularly small growth stocks, seem to forecast Jow The solution is exact in the limit of continuous returns on the aggregate stock market. Venkat time, if the representative investor bas clasticity R. Eleswarapu and Reingantim (2004) use of intertemporal substitution equal to one, and is lagged three-year retums on an equal-weighted otherwise a loglinear approximatioe. Camphell index of growth stocks, while Brennan et al. writes the solation in the form of a K-factor (2001) ase the difference between the log bookmodel, where the first factor is the market retarm to-market ration of small srowth stocks and small valse stocks to predict the aggregate market. In this paper we use a measure similar to that of Brennan et al. (2001) and find that. beva Coody arwe that the CAPM might hold conditionally. ances with declines in market discount meses. but fail socenditivally. Alhough Jonathan Lewellen and It is natural to ask why hight returas on small Sidan Naget (2003) shor that the magnitude of the value growth stocks should predict low returns on the efiect is too larpe to be explained by the conditional CAPA. stock market as a whole. This is a particularly. Tobias Adrian and Frascesce Fiavoni (2004) and Lewellen important question since time-series regressions and lay Shanken (2002) esplare learning at a powile. of aggregate stock returns on arbitrary predictor. explanakion of these anomalici. Richand Roil (19P7) cm- phavip the teak of the CAPA are misesified if ont variables can easily produce meaniogless data. caenot ineasure the market pordolio conrevly. Whik Hob- mined results. The most powerful motivation is ert Stamhegh (1982) and Shanken (19s7) find that the teas provided by the ICAPM itself. We know that of the CAPM afe insensitive to the inchaics if other value stocks outperform growth stocks, particfinancial asets, Camplell (19961. Jaganathas and Wanj blarly among smaller stocks, and that this can(1996), and Lettan and Ludvigson (2001) find that human-. alarly among smaller stocks, and that this cain- eapital wealth may be importam. Josef Lakonishok at al. not be explained by the traditional static CAPM. (1994), Patael L.a Fora (1996), and 1. Poria et al. (1997) arpue that itvostos' inationality drives the valas effost. Alon Brav et al. (2002) shon that analyst, price tarpot. - 3 Catepbell (19)b), Yumine L (1997, Mohent Hodrivk. consisted with the bypothesis that the value effect is doe to 2004). David Ne {2004, llui Chas (20013), and Chen (2003) expectational emors. If the ICAPM is io explain this anomaly, then small growth stocks mast have intentempora! bedeing value that offsets their low returns; that is, their returns must be negatively correlated with innovatioes to investment opportunities. In order to evaluate this hypothesis it is natural to ask whether a long moving average of smallgrouth-stock refurns peedicts investanent opportunities. This is exactly what we de when we where ri+1 is a log sock retarn, al +i is the log include the small-slock value spread in our fore- dividend paid by the stock, A denoter a onecasting model for market returns, In shart, the period change, E, denotes a national expectation small-elock value spread is not an arhitrary fore- at time t,and is a discoum coefficient. 4NO casting variable, tut one that is suggested by the denotes news about future cach flows fi.e. div. asset pricing theory we are trying to test. idends or consumptionk, and Ntur denctes neas The organization of the paper is as follows. In about future discount nates (ie., expected te: Sectice 1. we extinate two components of the tums). This equation, whicth is an accounting return on the aggregate stock market, one identity rather than a hehavicul model, says caused by cash-flow shocks and the other by that unexpected stock retums must he asvoci. discount-rate shocks. In Section II, we use theve ated with changes in expectations of furure cash components to estimate cash-flow and discount. flows of discount rales. An increase in expectiod rate betas for portfolios woried on firm charac furure cash flows is asiocialed with a capital teristics and risk loodings. In Section III, we lay gain today, whille an increase in discoount rates is evt the intenemporal asset pricing thesy that isociated witl a capital lass talay. The rease gustifies different risk premia for bad casb-flow is that with a given dividend stream, higher beta and good discouns rate beta. We also show forture returns can be generated only by future that the returns to samall and value stocks can price appenciation fruen a lower current price. lafgely be explained by alkowieg different risk These return coenpenents can also be inter. premia for these two different betas, Section IV peted approximately at permunent and transi. conelades. tory shocks to wealth. Returns generated by News Meve the Market rate news are offset by lower seturms in the fiture. From this perspective it should not be A simple presen-value formala points to two surprising that coeservative long-lerm investars reasos why stoek prices may change. Fither expected cash flows chanpe, diseount rates change, of both. lit this sectica, we empirically estimate these two components of unespected retum for a value-weighted stock market index. Consistent with findings of Campbell (1991). the fitted valoes saggest that over our sample period (Janeary 1929 to December 2001) discouat-fate news causes mach mode vartitien in menthly Mock retams than cash-low by mocuing a fractice of her motul tand ates every news. A. Retarn-Decompenditioe Framenod Following Campbell and Shiller (1988a) and asd le the evmapr cotediptio wade nie pratias by Campbell (1991), we use a loglincar approximate decompouition of return: dos ait tedane eyduiveb VOL. 94 NO: 5 CANPERL AND VVOU. THENTO MB GETA GOOC META are moee averie to cash-flow risk than to the state vector. We opt for l parsimonices discoun-rate risk. moskl with the following four state variables what are insights does this give you about beta?
why do you think of other dactors that could affect beta?
I really need for class!!!! would be much appreciated thank you sm!!!!!! 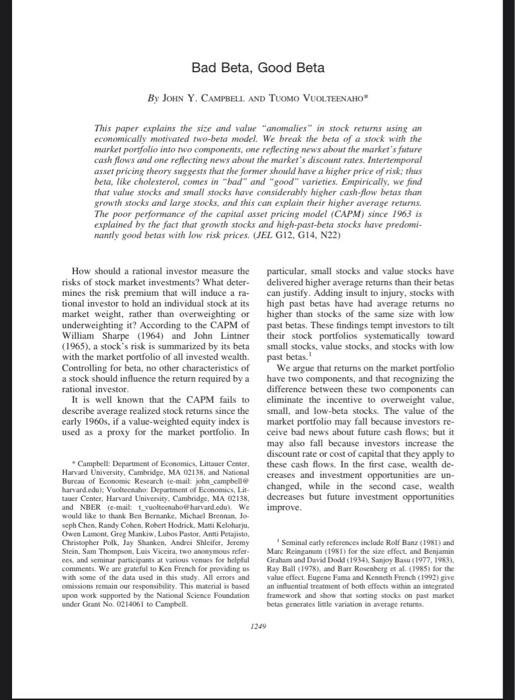
Step by Step Solution
There are 3 Steps involved in it
Step: 1

Get Instant Access to Expert-Tailored Solutions
See step-by-step solutions with expert insights and AI powered tools for academic success
Step: 2

Step: 3
Ace Your Homework with AI
Get the answers you need in no time with our AI-driven, step-by-step assistance
Get Started
Financial Management Core Concepts
Authors: Raymond M Brooks
2nd edition
132671034, 978-0132671033