

Answered step by step
Verified Expert Solution
Question
1 Approved Answer
GIVE SOLUTON USING POM QM - PROVIDE SCREEN SHOTS FOR VERIFICATION igure 2. First Quarter Sales Projections for 2019 Below is the historical 1st quarter
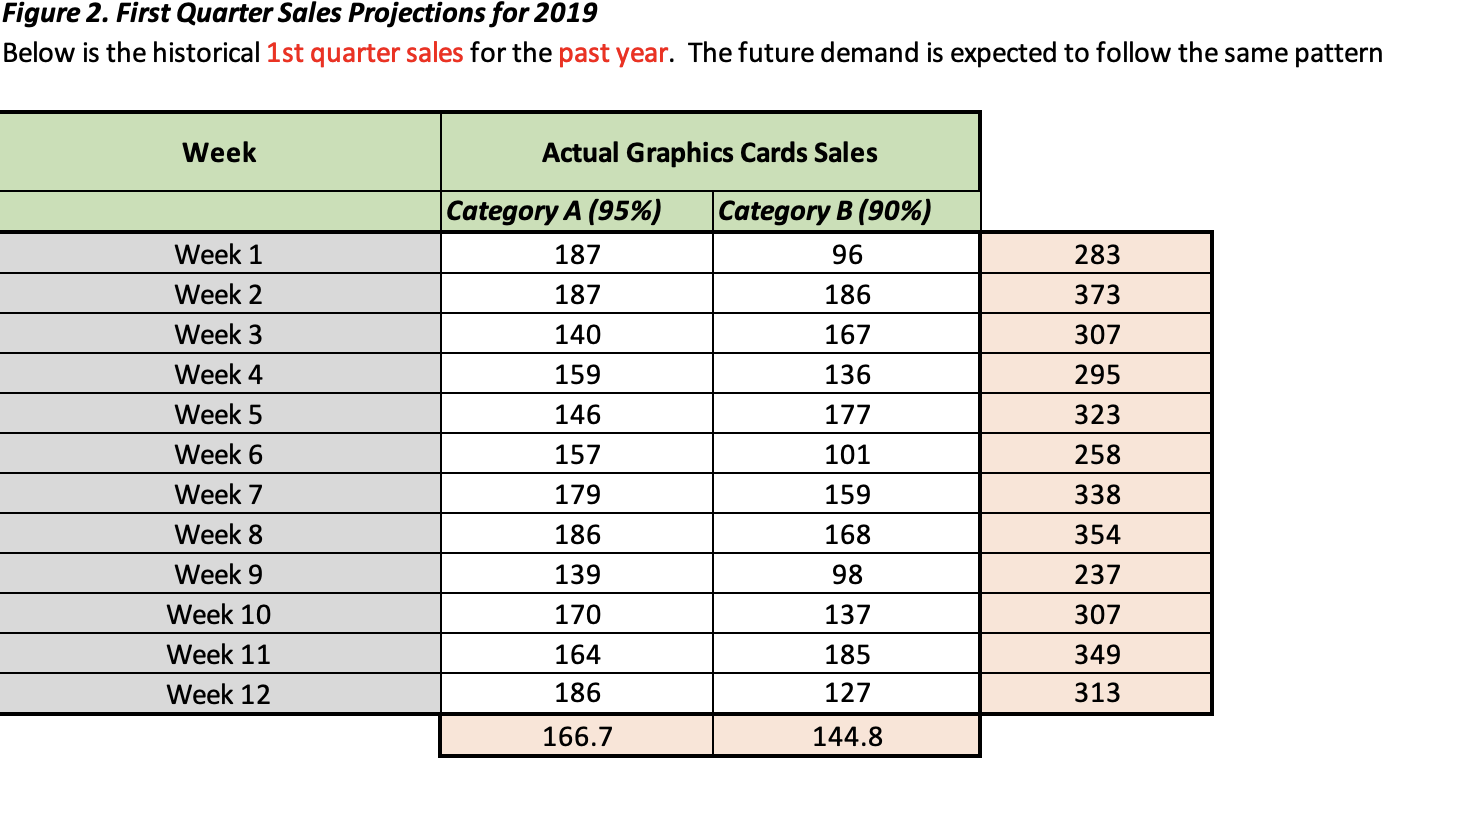

 GIVE SOLUTON USING POM QM - PROVIDE SCREEN SHOTS FOR VERIFICATION
Step by Step Solution
There are 3 Steps involved in it
Step: 1

Get Instant Access to Expert-Tailored Solutions
See step-by-step solutions with expert insights and AI powered tools for academic success
Step: 2

Step: 3
Ace Your Homework with AI
Get the answers you need in no time with our AI-driven, step-by-step assistance
Get Started
Towards A Strategic Human Resource Management Roles Of HR Audit And Org Culture
Authors: Adel Al Samman
1st Edition
3330653051, 978-3330653054