

Answered step by step
Verified Expert Solution
Question
1 Approved Answer
Give some Future Recommendations of each individual ratio on how the company can do well in the Future based on current situations/position of the company
Give some Future Recommendations of each individual ratio on how the company can do well in the Future based on current situations/position of the company
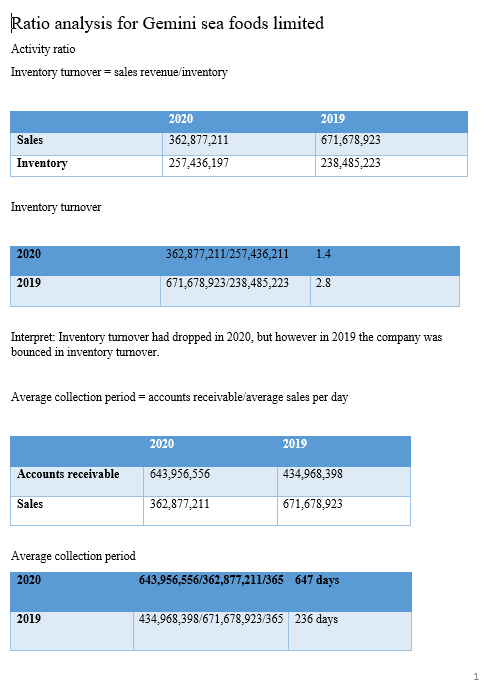
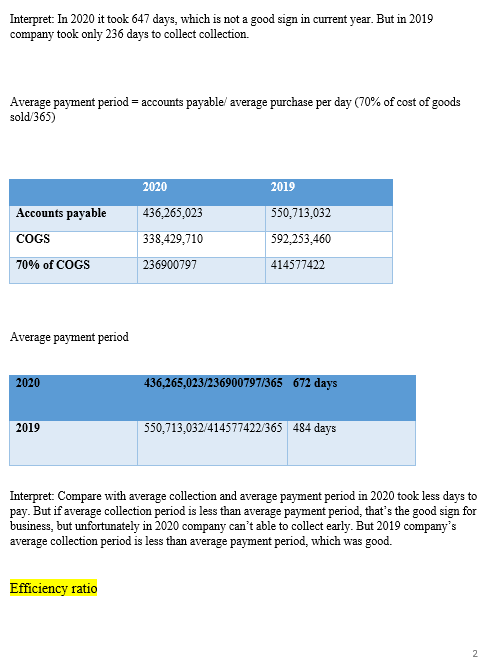
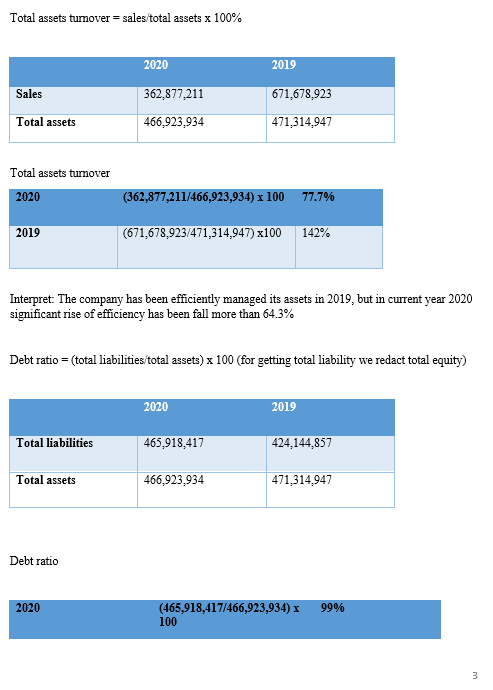
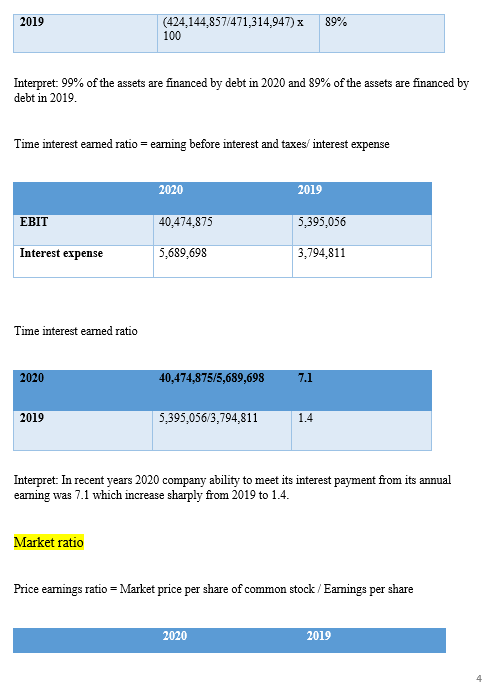
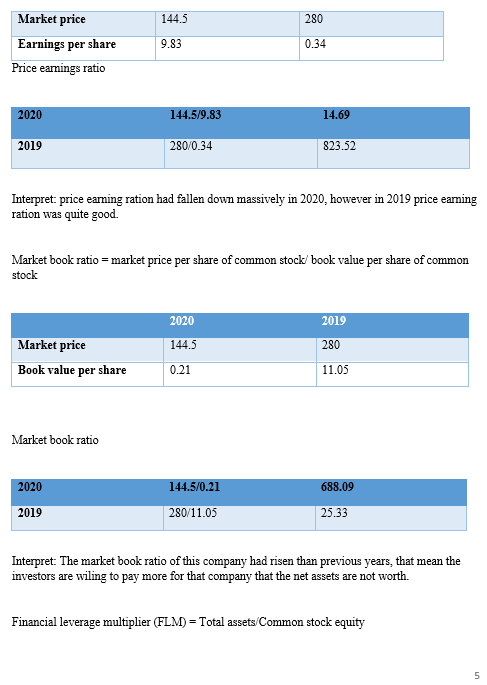
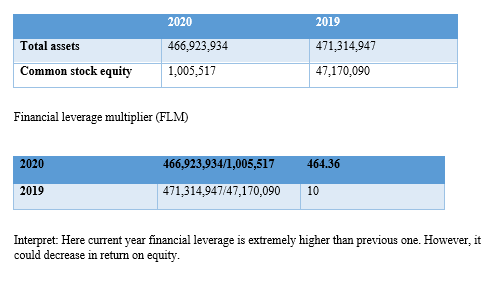
Ratio analysis for Gemini sea foods limited Activity ratio Inventory tumover = sales revenue inventory Sales 2020 362,877,211 257,436,197 2019 671,678,923 238,485,223 Inventory Inventory turnover 2020 362,877,211/257,436,211 1.4 2019 671,678,923/238,485,223 2.8 Interpret: Inventory tumover had dropped in 2020, but however in 2019 the company was bounced in inventory turnover. Average collection period = accounts receivable average sales per day 2020 2019 Accounts receivable 643,956,556 434,968,398 Sales 362,877,211 671,678,923 Average collection period 2020 643,956,556/362,877,211/365 647 days 2019 434,968,398/671,678,923/365 236 days 1 Interpret: In 2020 it took 647 days, which is not a good sign in current year. But in 2019 company took only 236 days to collect collection. Average payment period = accounts payable average purchase per day (70% of cost of goods sold/365) 2020 2019 Accounts payable COGS 436,265,023 338.429,710 550,713,032 592,253,460 70% of COGS 236900797 414577422 Average payment period 2020 436,265,023/236900797/365 672 days 2019 550,713,032/414577422/365 484 days Interpret: Compare with average collection and average payment period in 2020 took less days to pay. But if average collection period is less than average payment period, that's the good sign for business, but unfortunately in 2020 company can't able to collect early. But 2019 company's average collection period is less than average payment period, which was good. Efficiency ratio 2 Total assets tumover = sales total assets x 100% 2020 2019 Sales 362,877,211 671,678,923 Total assets 466,923,934 471,314,947 Total assets tumover 2020 (362,877,211/466,923,934) x 100 77.7% 2019 (671,678,923/471,314,947) x100 142% Interpret. The company has been efficiently managed its assets in 2019, but in current year 2020 significant rise of efficiency has been fall more than 64.3% Debt ratio = (total liabilities total assets) x 100 (for getting total liability we redact total equity) 2020 2019 Total liabilities 465,918,417 424,144,857 Total assets 466,923,934 471,314,947 Debt ratio 2020 99% (465,918,417/466,923,934) x 100 3 2019 (424,144,857/471,314,947) x 100 89% Interpret: 99% of the assets are financed by debt in 2020 and 89% of the assets are financed by debt in 2019. Time interest eamed ratio = earning before interest and taxes/ interest expense 2020 2019 EBIT 40,474,875 5,395,056 Interest expense 5,689,698 3,794,811 Time interest earned ratio 2020 40,474,875/5,689,698 7.1 2019 5,395,056/3,794,811 1.4 Interpret: In recent years 2020 company ability to meet its interest payment from its annual earning was 7.1 which increase sharply from 2019 to 1.4. Market ratio Price earnings ratio = Market price per share of common stock/Eamings per share 2020 2019 144.5 280 Market price Earnings per share Price earnings ratio 9.83 0.34 2020 144.5/9.83 14.69 2019 280/0.34 823.52 Interpret: price earning ration had fallen down massively in 2020, however in 2019 price earning ration was quite good. Market book ratio = market price per share of common stock/ book value per share of common stock 2020 2019 144.5 280 Market price Book value per share 0.21 11.05 Market book ratio 2020 144.5/0.21 688.09 2019 280/11.05 25.33 Interpret: The market book ratio of this company had risen than previous years, that mean the investors are wiling to pay more for that company that the net assets are not worth. Financial leverage multiplier (FLM)= Total assets/Common stock equity 5 2020 2019 Total assets 466,923,934 471,314,947 47,170,090 Common stock equity 1,005,517 Financial leverage multiplier (FLM) 2020 464.36 466,923,934/1,005,517 471,314,947/47,170,090 2019 10 Interpret: Here current year financial leverage is extremely higher than previous one. However, it could decrease in return on equityStep by Step Solution
There are 3 Steps involved in it
Step: 1

Get Instant Access to Expert-Tailored Solutions
See step-by-step solutions with expert insights and AI powered tools for academic success
Step: 2

Step: 3
Ace Your Homework with AI
Get the answers you need in no time with our AI-driven, step-by-step assistance
Get Started
Investments An Introduction
Authors: Herbert B Mayo
9th Edition
324561385, 978-0324561388