GIVE TYPED WRITING SO I CAN UNDERSTAND CLEARLY.
Kindly give correct answers and step by step working.do not skip steps.Mention clearly about the formula and the conversion.be very clear.do not skip steps.be very clear.NUMBER THE Ans CLEARLY.
QMT245 march2017
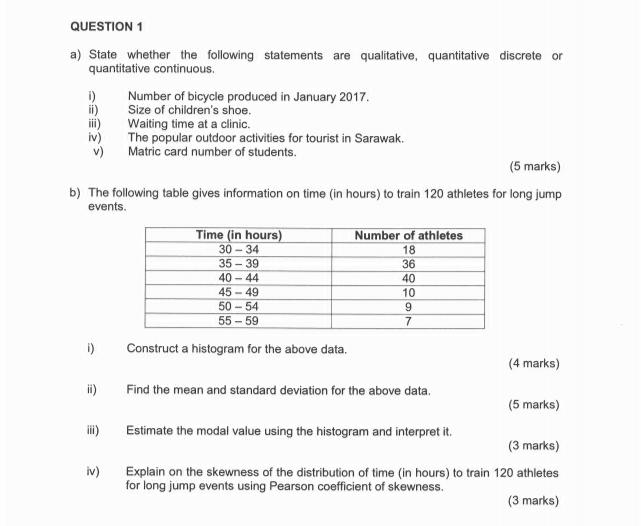
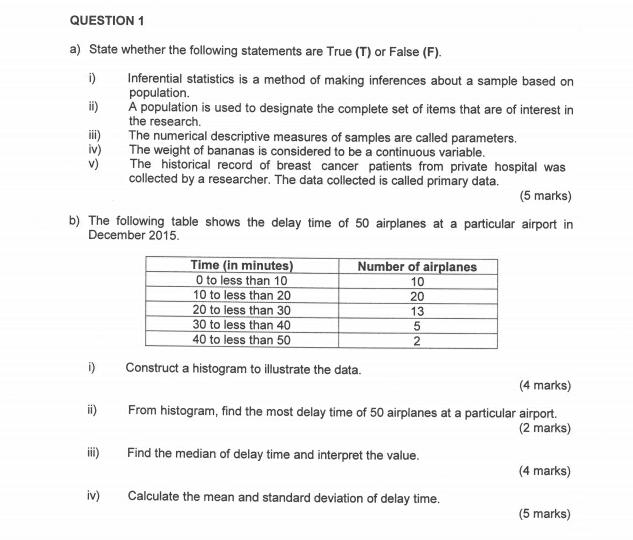
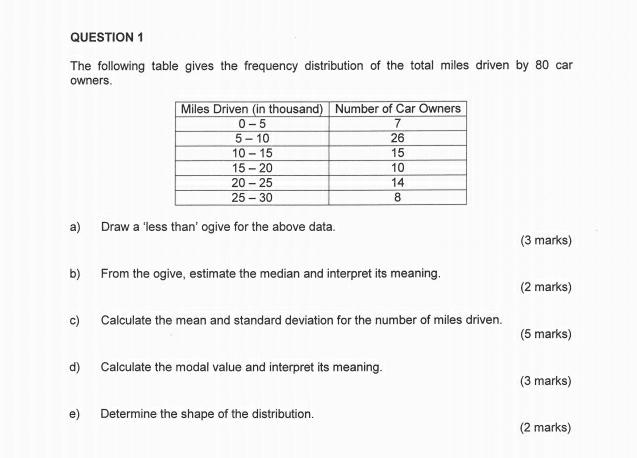
QUESTION 1 a) State whether the following statements are qualitative, quantitative discrete or quantitative continuous. Number of bicycle produced in January 2017. 199 Size of children's shoe. iii) Waiting time at a clinic. iv) The popular outdoor activities for tourist in Sarawak. v ) Matric card number of students. (5 marks) b) The following table gives information on time (in hours) to train 120 athletes for long jump events. Time (in hours) Number of athletes 30 - 34 18 35 - 39 36 40 -44 40 45 - 49 10 50 -54 9 55 - 59 7 Construct a histogram for the above data. (4 marks) ii) Find the mean and standard deviation for the above data. (5 marks) iii) Estimate the modal value using the histogram and interpret it. (3 marks) iv ) Explain on the skewness of the distribution of time (in hours) to train 120 athletes for long jump events using Pearson coefficient of skewness. (3 marks)QUESTION 1 a) State whether the following statements are True (T) or False (F). Inferential statistics is a method of making inferences about a sample based on population. ii) A population is used to designate the complete set of items that are of interest in the research. iii) The numerical descriptive measures of samples are called parameters. iv) The weight of bananas is considered to be a continuous variable. The historical record of breast cancer patients from private hospital was collected by a researcher. The data collected is called primary data, (5 marks) b) The following table shows the delay time of 50 airplanes at a particular airport in December 2015. Time (in minutes) Number of airplanes 0 to less than 10 10 10 to less than 20 20 20 to less than 30 13 30 to less than 40 5 40 to less than 50 2 D) Construct a histogram to illustrate the data. (4 marks) ii) From histogram, find the most delay time of 50 airplanes at a particular airport. (2 marks) Find the median of delay time and interpret the value. (4 marks) iv ) Calculate the mean and standard deviation of delay time. (5 marks)QUESTION 1 The following table gives the frequency distribution of the total miles driven by 80 car owners. Miles Driven (in thousand) Number of Car Owners 0 -5 5-10 26 10 -15 15 15 - 20 10 20 - 25 14 25 - 30 8 a) Draw a 'less than' ogive for the above data. (3 marks) b) From the ogive, estimate the median and interpret its meaning. (2 marks) c) Calculate the mean and standard deviation for the number of miles driven. (5 marks) d) Calculate the modal value and interpret its meaning. (3 marks) e) Determine the shape of the distribution. (2 marks)